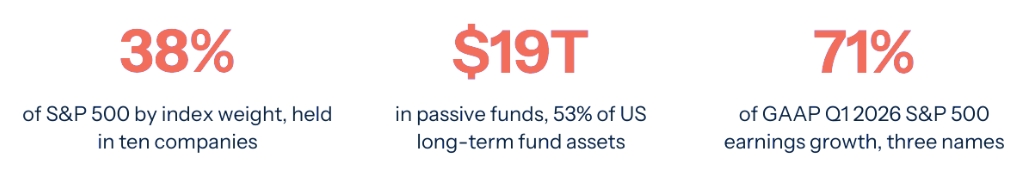
The top ten S&P 500 companies hold approximately 38 percent of index weight, a level roughly 40 percent above the dot-com peak of 2000, with eight of those ten linked through the artificial intelligence ecosystem. Three of them, Alphabet, Amazon, and Meta, contributed approximately 71 percent of the GAAP Q1 2026 net dollar increase in S&P 500 earnings, though much of that contribution reflected one-time investment-stake gains and tax benefits rather than operating performance, and the trio's adjusted contribution is materially smaller. Passive investing has reached 53 percent of US long-term fund assets, $19 trillion in indexed funds, and academic research published in December 2025 confirms that passive inflows reduce price elasticity for the largest stocks and raise their valuations beyond what fundamentals justify. The result is a concentrated bet on AI monetization that most American households hold through index-tracking retirement accounts. In 2026, the feedback has begun reversing for the first time in four years, with equal-weight indices outperforming cap-weight by approximately four percentage points year-to-date. The question for the second half of 2026 is whether the unwind is orderly, or whether the same passive-flow dynamics that produced the concentration begin running in reverse with the same amplification.
The Great Narrowing
The numerical history is unambiguous. Through the 1990s, the top ten S&P 500 stocks held approximately 20 percent of index weight, a level consistent with the previous three decades.1 The dot-com boom pulled the figure to roughly 27 percent at the 2000 intra-year peak, after which it retraced. By 2010 it had returned to 19 percent. By 2015, 18 percent.2
The current expansion began in 2017 and accelerated after 2022. The figure reached 30 percent in 2023, 37 percent in mid-2024, and 40.7 percent at the 2025 peak. As of the end of Q1 2026, the top ten line items in the index sum to 36.5 percent by free-float weight; consolidating Alphabet's two share classes into a single company brings the company-aggregated figure to approximately 38 percent.3 See Exhibit 1. The Q1 2026 retracement from the late-2025 peak reflects the equal-weight outperformance discussed later in this report. The line is not a cyclical fluctuation. The decade since 2015 has produced roughly an eighteen-percentage-point increase, more than triple the typical range of historical variation.
EXHIBIT 1: The Concentration Curve
Top-10 S&P 500 share of index weight, 1990 to Q1 2026, line-item basis (company-aggregated reading is approximately 38%).
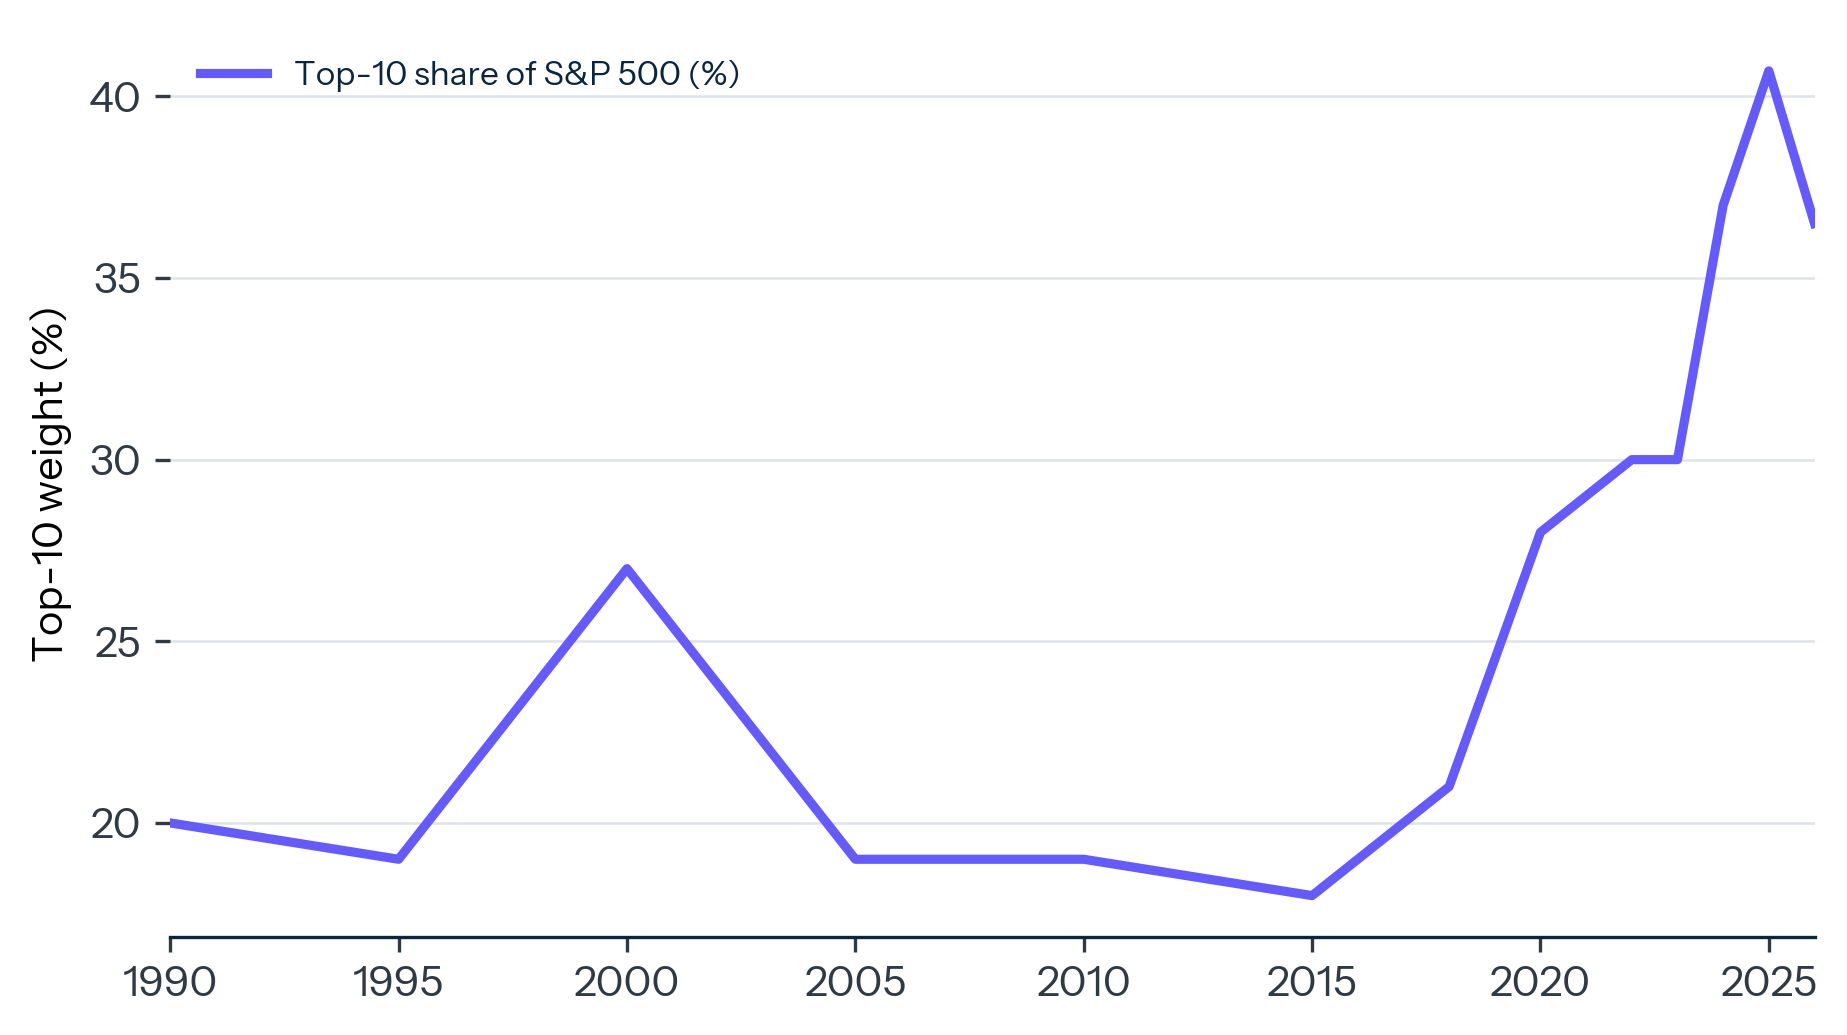
Source: RBC Wealth Management/FactSet historical data; Slickcharts, March 31, 2026 (line-item basis).
What changed is also the composition. The dot-com top ten spanned sectors: General Electric, Cisco, Exxon Mobil, Microsoft, Intel, Oracle, IBM, Lucent, Walmart, and Citigroup. Industrials, energy, technology hardware, software, retail, and financials each had a top-ten representative. The current top ten is structurally narrower. By free-float weight, the leaders are Nvidia at 7.6 percent, Apple at 6.7, Alphabet (Class A and C combined) at 5.4, Microsoft at 4.9, Amazon at 3.6, Broadcom at 2.6, Meta at 2.2, Tesla at 1.9, Berkshire Hathaway at 1.6, and Eli Lilly at approximately 1.4.4 Eight of the ten are linked through the artificial intelligence ecosystem. The remaining 490 companies hold the balance.
In 2000, an S&P 500 holder owned a cross-section of the American industrial economy weighted toward its largest firms, spanning sectors with structurally different earnings drivers. The largest firms today are interconnected components of a single technology stack: silicon (Nvidia, Broadcom), cloud infrastructure (Microsoft, Amazon, Alphabet), platforms (Apple, Meta), and AI-adjacent consumer demand (Tesla). Their earnings rise and fall on overlapping theses about AI monetization timelines. Diversification within the index has narrowed even as the index has appeared to grow.
International comparisons sharpen the picture. The MSCI World Index, which weights global developed-market equities by market capitalization, holds approximately 70 percent of its assets in US stocks. The S&P 500's concentration therefore propagates through the global benchmark used by most cross-border passive vehicles. Within Europe, the Stoxx 600 top-ten share has held in a 22 to 27 percent range through the same period in which the S&P 500's doubled. The UK's FTSE 100, while concentrated in different ways at its top (financials, energy, and consumer staples), shows a top-ten share near 50 percent of index weight, reflecting a smaller universe rather than the same passive flow dynamic. The S&P 500's pattern is therefore not generic to large-cap equity benchmarks. It reflects the specific intersection of a deep passive flow regime with a US tech sector that scaled into AI capex during the 2017 to 2025 period at a pace no comparable European or Japanese counterpart could match.
The Passive Engine
The concentration buildup has coincided with, and was substantially produced by, the structural shift in how Americans invest. In December 2023, indexed mutual funds and ETFs surpassed actively managed funds in total assets for the first time, $13.293 trillion to $13.234 trillion.5 The margin has widened since. As of the March 2026 release from the Investment Company Institute, indexed funds held $19.09 trillion against $17.12 trillion for active, a 52.7 percent passive share of all US long-term fund assets.6 See Exhibit 2.
EXHIBIT 2: The Passive Crossover
US long-term fund AUM, passive vs. active ($T), at five-year intervals.
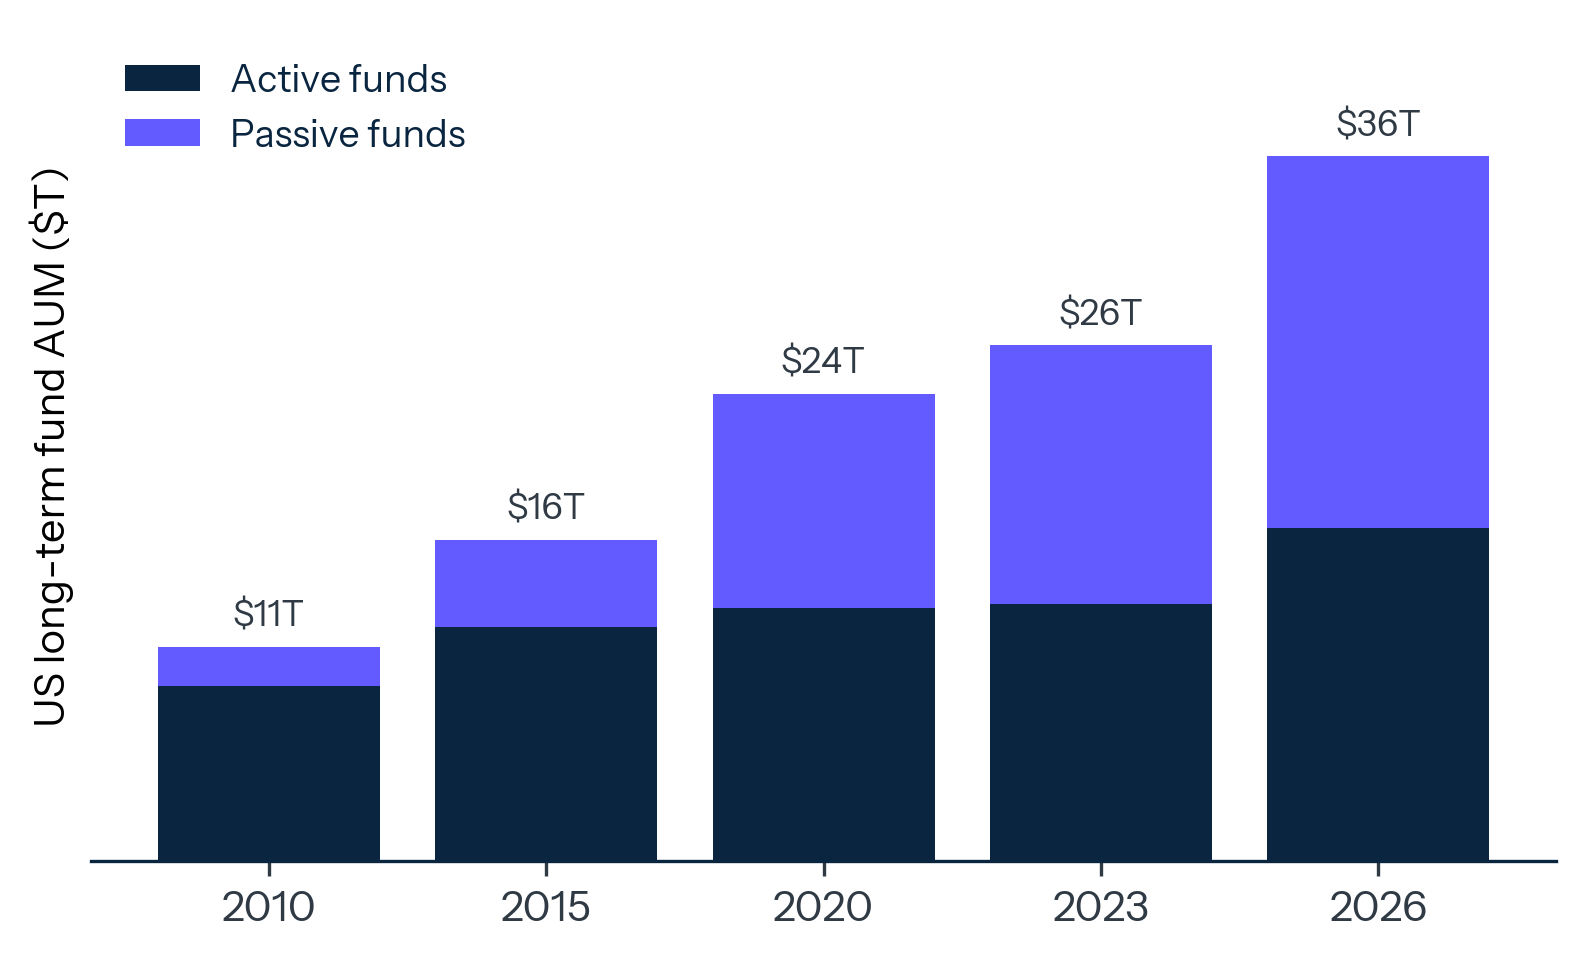
Source: Investment Company Institute, Active and Index Investing Release, March 2026; ICI Fact Book trend series.
The cumulative flow figures tell the same story. Over the past decade, passive US equity funds attracted $2.8 trillion in net inflows. Active funds experienced $3.0 trillion in net outflows. The substitution was nearly one-for-one.7 Five-year flow data show acceleration: $1.0 trillion into passive in the five years ending 2019, $1.6 trillion in the five years ending 2024.
The mechanism by which this shift produces concentration was formally established in December 2025. In a paper published in the Review of Financial Studies, Hao Jiang of Michigan State, Dimitri Vayanos of LSE, and Lu Zheng of UC Irvine demonstrated that passive inflows disproportionately raise the prices of the economy's largest firms.8 The mechanism is price-elasticity reduction. As passive ownership rises, the marginal price-setter for any given stock shifts from active managers, who form views on value, toward passive funds, which hold positions regardless of price. The market's willingness to push back against mispricing falls. The authors calibrate an elasticity of 4.0 for passive flow effects, twenty times the conventional aggregate-market estimate.
The mechanism has a distinctive empirical signature in monthly return data. Etula, Rinne, Suominen, and Vaittinen, writing in the Review of Financial Studies in 2020, document a systematic turn-of-month effect in US equity returns: average returns are low from trading days T-8 to T-4 as institutional investors sell to meet month-end cash obligations, then high from T-3 through T+3 as distributed cash flows back into the market through retirement plan contributions and dividend reinvestment.9 Etula and colleagues identify the flow pattern at the aggregate level. The Jiang, Vayanos, and Zheng mechanism implies the effect should concentrate in the largest stocks, because passive flows enter the index proportionally to weight and the marginal price-setter for the largest names is least elastic. The composite is the empirical fingerprint of the underlying flow mechanism, observable in equity prices on a monthly cadence and traceable to the architecture of the American payment system.
A second-order effect compounds the first. Reduced elasticity raises the idiosyncratic risk of holding a short position in a passive-owned mega-cap, which discourages active managers from arbitraging away the mispricing. The dispersion between price and fundamental value can therefore widen and persist. Goldman Sachs estimated in November 2024 that passive ownership accounts for 24 percent of S&P 500 market capitalization on a dollar-weighted basis. The median S&P 500 stock is 26 percent passively owned, up from roughly 17 percent in 2010.10 The dollar-weighted figure trails the median because the very largest names still carry comparatively more active conviction in their float. The disproportionate flow effect operates at the margin, on incremental contributions, where passive money is the dominant marginal buyer.
The European Central Bank quantified the diversification cost in its November 2024 Financial Stability Review. Using euro area equity data from 2010 through 2024, the ECB estimated that each percentage point increase in passive ownership share raises the correlation coefficient between a stock and its index by approximately 0.005.11 Applied to the nine-percentage-point rise in passive ownership of the median S&P 500 stock since 2010 (from 17 to 26 percent, per Goldman Sachs), the implied cumulative correlation effect is approximately 0.045. Stocks within the index move together more closely than they did when active managers dominated price discovery.
The conventional passive ownership measurement also understates the underlying reality. Alex Chinco of Baruch College and Marco Sammon of Harvard Business School, writing in the Journal of Financial Economics in 2024, develop an identification strategy based on index-reconstitution trading volume and estimate that true passive ownership of the US stock market reached approximately 33.5 percent in 2021, roughly double the conventional industry estimate of 16 percent that includes only declared index mutual funds and ETFs. The additional 17 percentage points come from direct indexing by institutions and closet indexing inside nominally active funds.12 The implication is that the price-elasticity reduction identified by Jiang and colleagues operates across a materially larger share of the float than headline figures suggest, and that the unwind dynamics in a sustained drawdown would be correspondingly larger in magnitude.
The Single Bet
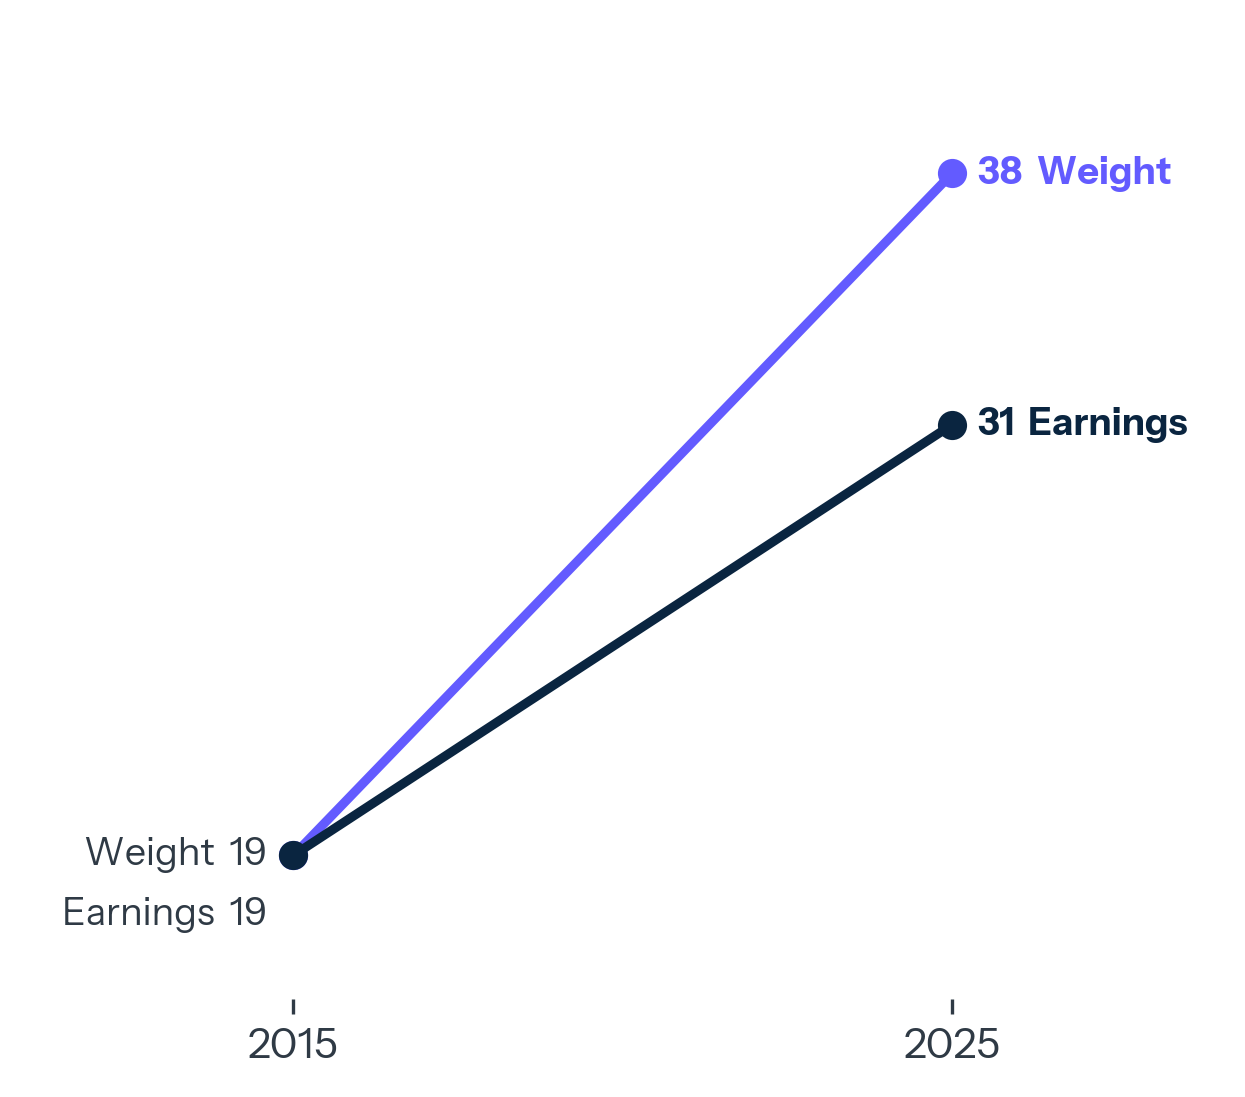
The concentration of weight has not been matched by a concentration of earnings. As of year-end 2025, the top ten S&P 500 stocks held approximately 38 percent of market capitalization but generated approximately 31 percent of index earnings.13 See Exhibit 3. The seven-percentage-point gap is the valuation premium that passive ownership has produced. In 2015, when concentration was near its post-1990 low, weight and earnings share were roughly matched. The gap has opened during the decade of passive AUM expansion.
EXHIBIT 3: Weight Without Earnings
Top-10 S&P 500 share of index weight vs. share of index earnings (%), 2015 vs. 2025.
Source: Goldman Sachs US Equity Research Q4 2025; JPMorgan Asset Management, Guide to the Markets, December 31, 2025.
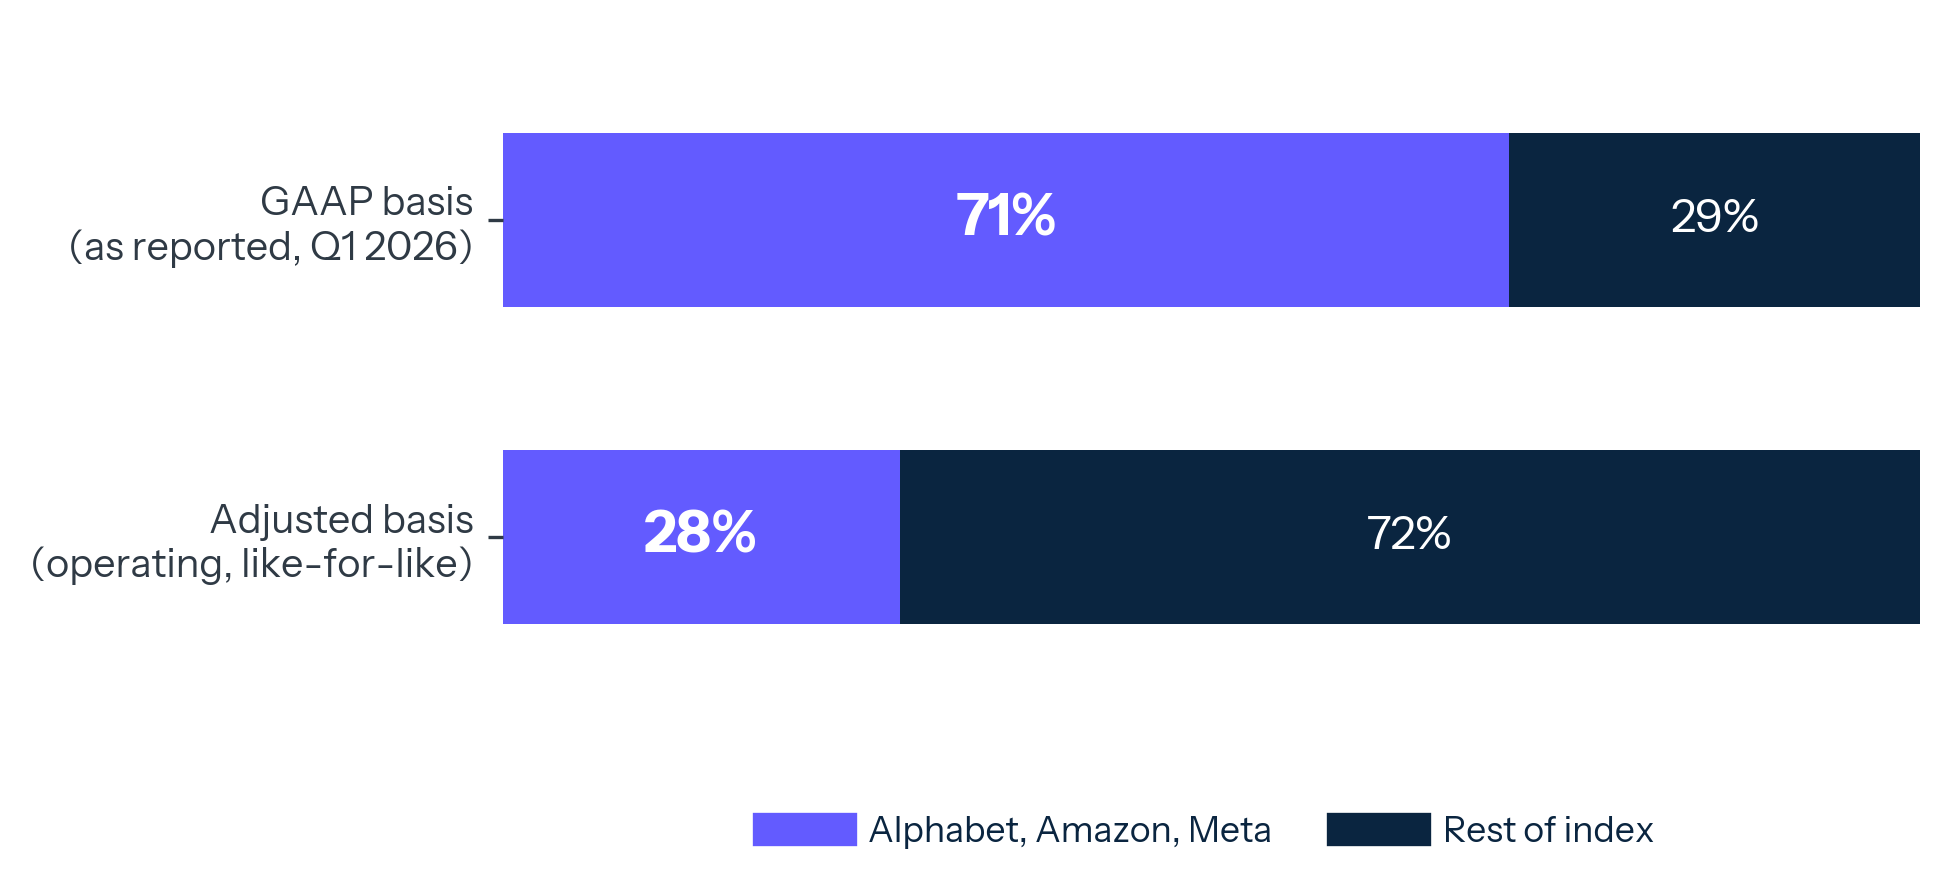
The earnings concentration is more acute when measured by incremental contribution. On a GAAP basis, three companies, Alphabet, Amazon, and Meta, accounted for approximately 71 percent of the net dollar increase in S&P 500 realized Q1 2026 earnings.14 The headline beats were striking: Alphabet $5.11 versus a $2.63 consensus, Amazon $2.78 versus $1.63, Meta $10.44 versus $6.67. The headline figures, however, are inflated by one-time items that the consensus estimates did not include. Alphabet's quarter contained a $36.9 billion gain on equity securities, largely the mark-to-market on its Anthropic stake, contributing approximately $2.35 to diluted EPS; excluding the gain, operating EPS was approximately $2.76, a modest single-digit beat. Amazon's quarter contained a roughly $16.8 billion pre-tax gain on the same Anthropic position, adding approximately $1.24 per share; excluding the gain, EPS was approximately $1.54, slightly below consensus. Meta's results included an $8.03 billion one-time tax benefit from IRS Notice 2026-7, the additional interim Corporate Alternative Minimum Tax guidance addressing previously capitalized Section 174 R&E expenditures; excluding the benefit, EPS was approximately $7.31 versus the $6.67 consensus, a clean beat of approximately ten percent.
The decomposition reframes the headline. On an adjusted basis that strips the one-time items, the trio's contribution to the Q1 2026 S&P 500 earnings increase falls materially below the GAAP 71 percent figure. The Anthropic mark-up alone added roughly $54 billion of pre-tax net income to Alphabet and Amazon combined, with Meta's tax benefit adding another $8 billion; together these three line items account for the bulk of the trio's surprise versus consensus. The genuine operating contribution from the three companies to index-level earnings growth is closer to a quarter or a third of the total, not seventy percent. That range is an approximation on a like-for-like adjusted basis, in which the index-level denominator is also stripped of comparable one-time items at other constituents; the precise figure depends on which adjustments one accepts, but the direction is unambiguous. The gap is itself an artifact of the same AI investment cycle the broader thesis is built on, reflected back into hyperscaler accounting through equity-securities gains on the venture stakes that the hyperscalers are themselves funding. The headline earnings concentration is therefore partly an echo of the investment story, not independent operating evidence for it.
Nvidia is conspicuous in its absence from the trio. The reason is that Nvidia's expected 2026 growth was already priced into consensus before earnings season began, leaving little room for upside surprise on either GAAP or adjusted measures. By FactSet's measurement, Nvidia remains the single largest absolute contributor to 2026 S&P 500 EPS levels; the three hyperscalers above are the largest contributors to the quarter's net dollar earnings increase on a GAAP basis but contribute substantially less on an operating basis. The distinction matters for risk. Both ends of that decomposition produce index moves of historically large magnitude when surprised, and the operating-basis view is the one investors should rely on going forward.
This is the form of the bet embedded in most American retirement accounts. At year-end 2025, 401(k) plans held $10.1 trillion in assets.15 Index funds account for 57 percent of equity mutual fund assets within those plans, up from 36 percent in 2016.16 The default option in most target-date funds is equity exposure benchmarked to the S&P 500 or its global equivalent. The construction of an individual American's retirement equity position is therefore determined by the construction of the index, which is determined by the price action of the largest companies, which is determined in part by the passive flows that those same Americans contribute every payday.
The feedback runs the full circle. Contributions enter passive funds. Passive funds buy proportionally across the index. The largest stocks receive the largest dollar allocation. Their prices rise more than fundamentals justify. Index weights tilt further toward them. Subsequent contributions reproduce the cycle.
The asset management industry that intermediates this flow has its own concentration. BlackRock, Vanguard, and State Street collectively manage the large majority of US passive ETF assets, with industry estimates placing their combined share in the high-eighties of percent as of 2025; on a broader basis that includes index mutual funds, the three firms collectively vote shares representing roughly a quarter of S&P 500 market capitalization.17 Their stewardship teams set the terms of corporate governance engagement for a substantial share of American public-company shareholdership. The passive flow that produces the index concentration described above also produces a parallel concentration of voting power and capital-allocation influence in three asset managers. Neither dimension of concentration is the subject of active investor consent at the level of the 401(k) participant whose contributions fund both.
The Crack in the Feedback
The cycle's first material reversal in four years is now visible. The Invesco S&P 500 Equal Weight ETF (RSP), which holds the same 500 companies as the cap-weighted index but assigns each a 0.2 percent weight, has outperformed the SPDR S&P 500 ETF (SPY) by approximately four percentage points year-to-date in 2026.18 See Exhibit 4. The reversal is the inverse of 2023 and 2024, when SPY beat RSP by 12.5 and 12.1 percentage points respectively.
EXHIBIT 4: The Equal-Weight Crack
Annual total returns: SPY (cap-weight) vs. RSP (equal-weight), 2022 to 2026 YTD.
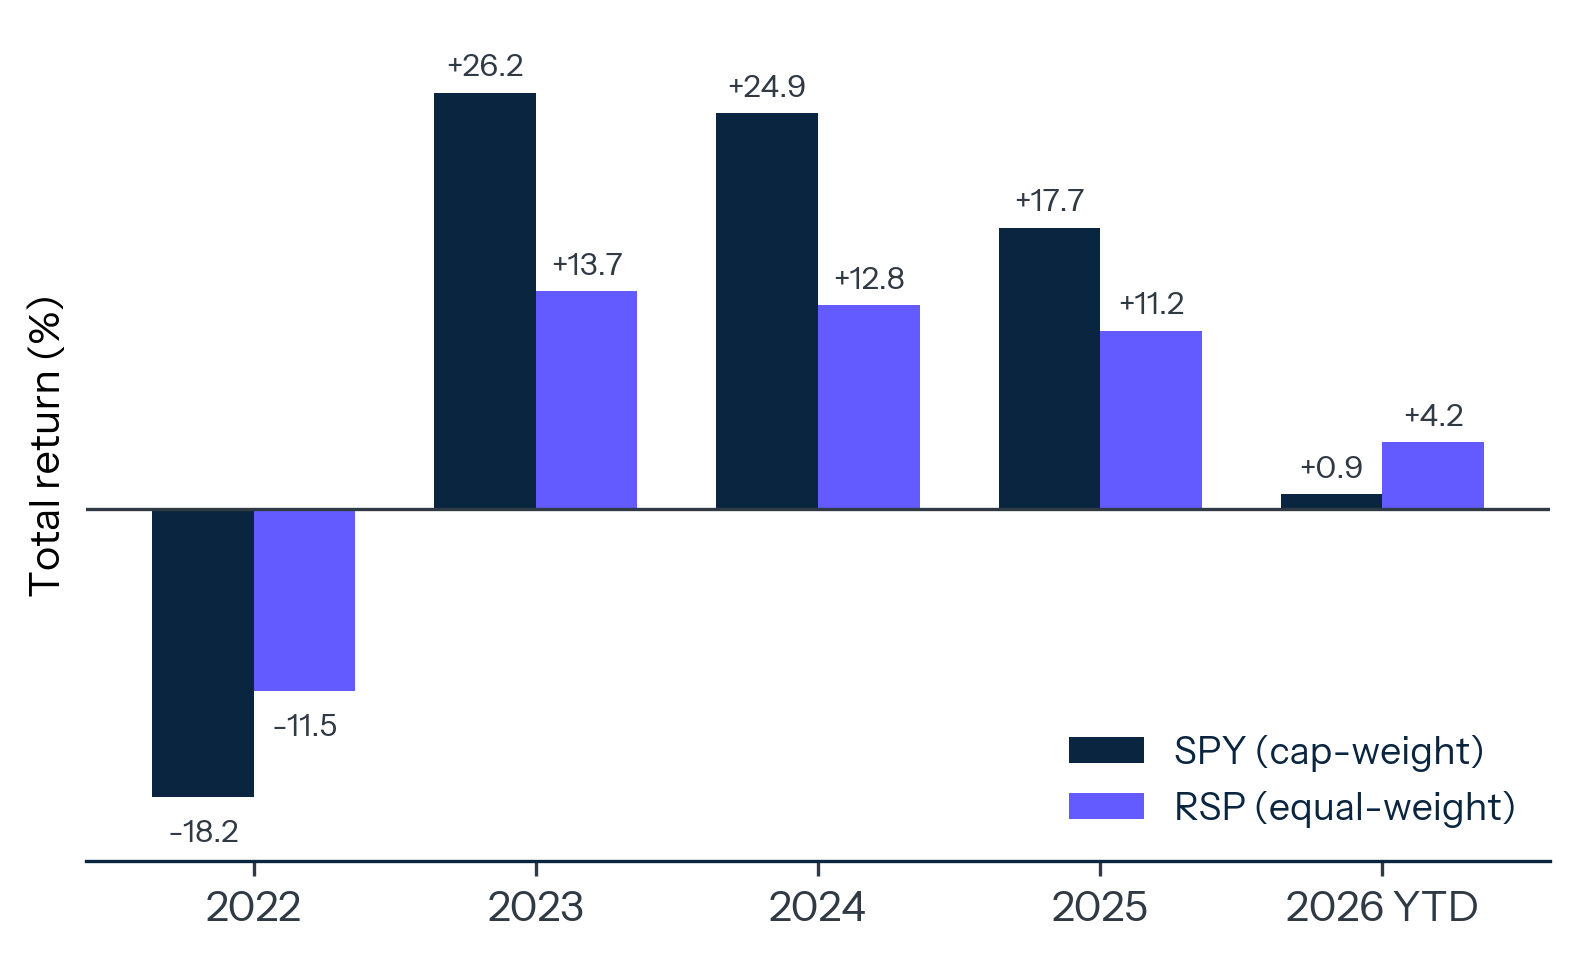
Source: PortfoliosLab; ETFCentral; 24/7 Wall St., April 9, 2026.
The 2026 divergence resulted from the same mechanism running in reverse. As mega-cap tech valuations faced scrutiny in the first quarter, Microsoft fell approximately 16 percent at its low. Apple, Nvidia, and Alphabet experienced corresponding pressure. The cap-weighted index, with over 30 percent technology exposure concentrated in the top names, dragged. The equal-weight index, with 16 percent industrials, 15 percent financials, and 14 percent technology distributed across many holdings, did not.
The historical precedent is 2022. In that year, SPY fell 18.2 percent while RSP fell 11.5 percent. The 6.7-percentage-point gap reflected the same dynamic: the largest, most passive-owned stocks suffered most as rate-driven multiple compression worked through the system. The 2026 episode is structurally similar. The largest stocks face a different test, around AI monetization timelines, but the equal-weight outperformance signal is the same.
What separates the 2026 episode is the underlying state of passive ownership. In 2022, the passive share of US fund assets was approximately 48 percent. Today it is 53 percent. The Jiang, Vayanos, and Zheng (2025) mechanism implies the unwind effects, when they occur, should be larger and more concentrated in the names that received the most disproportionate passive inflows. Should the 2026 trajectory continue, the principal risk in this configuration is the unevenness of the decline. The largest stocks should underperform the broader index by margins that have no historical analog at current passive-ownership shares.
The longer historical pattern reinforces the concern. The 2000 to 2002 unwind saw the S&P 500 decline approximately 49 percent peak-to-trough, with the information technology sector down approximately 80 percent over the same period and the backtested S&P 500 Equal Weight Index outperforming the cap-weighted benchmark by roughly 30 to 35 cumulative percentage points across the cycle.19 The 1973 to 1974 episode produced a similar pattern around the Nifty Fifty: a small set of growth names whose valuations had decoupled from earnings underperformed the broader market by margins that ran from 60 percent to over 90 percent for individual names against an S&P 500 decline near 48 percent. Both prior episodes occurred at passive ownership levels far below today's. The structural amplification mechanism that Jiang and colleagues identified did not yet operate at the scale it does now. The historical baseline for an analogous unwind is therefore the bottom of the prior episodes' ranges, not the midpoint.
Implications
For retirement savers. The standard argument for index investing assumes the index itself is diversified. At 38 percent concentration in ten companies, and approximately 32 percent in the Magnificent Seven sharing a common earnings thesis, the assumption breaks at the top of the market-cap distribution. See Exhibit 5. A 401(k) participant who allocates fully to an S&P 500 fund today is holding a position that any institutional risk committee would flag for concentration approval. Target-date funds that default to passive equity exposure inherit the concentration directly.
EXHIBIT 5: The Ten Names
S&P 500 top-10 by free-float index weight (%), March 31, 2026.
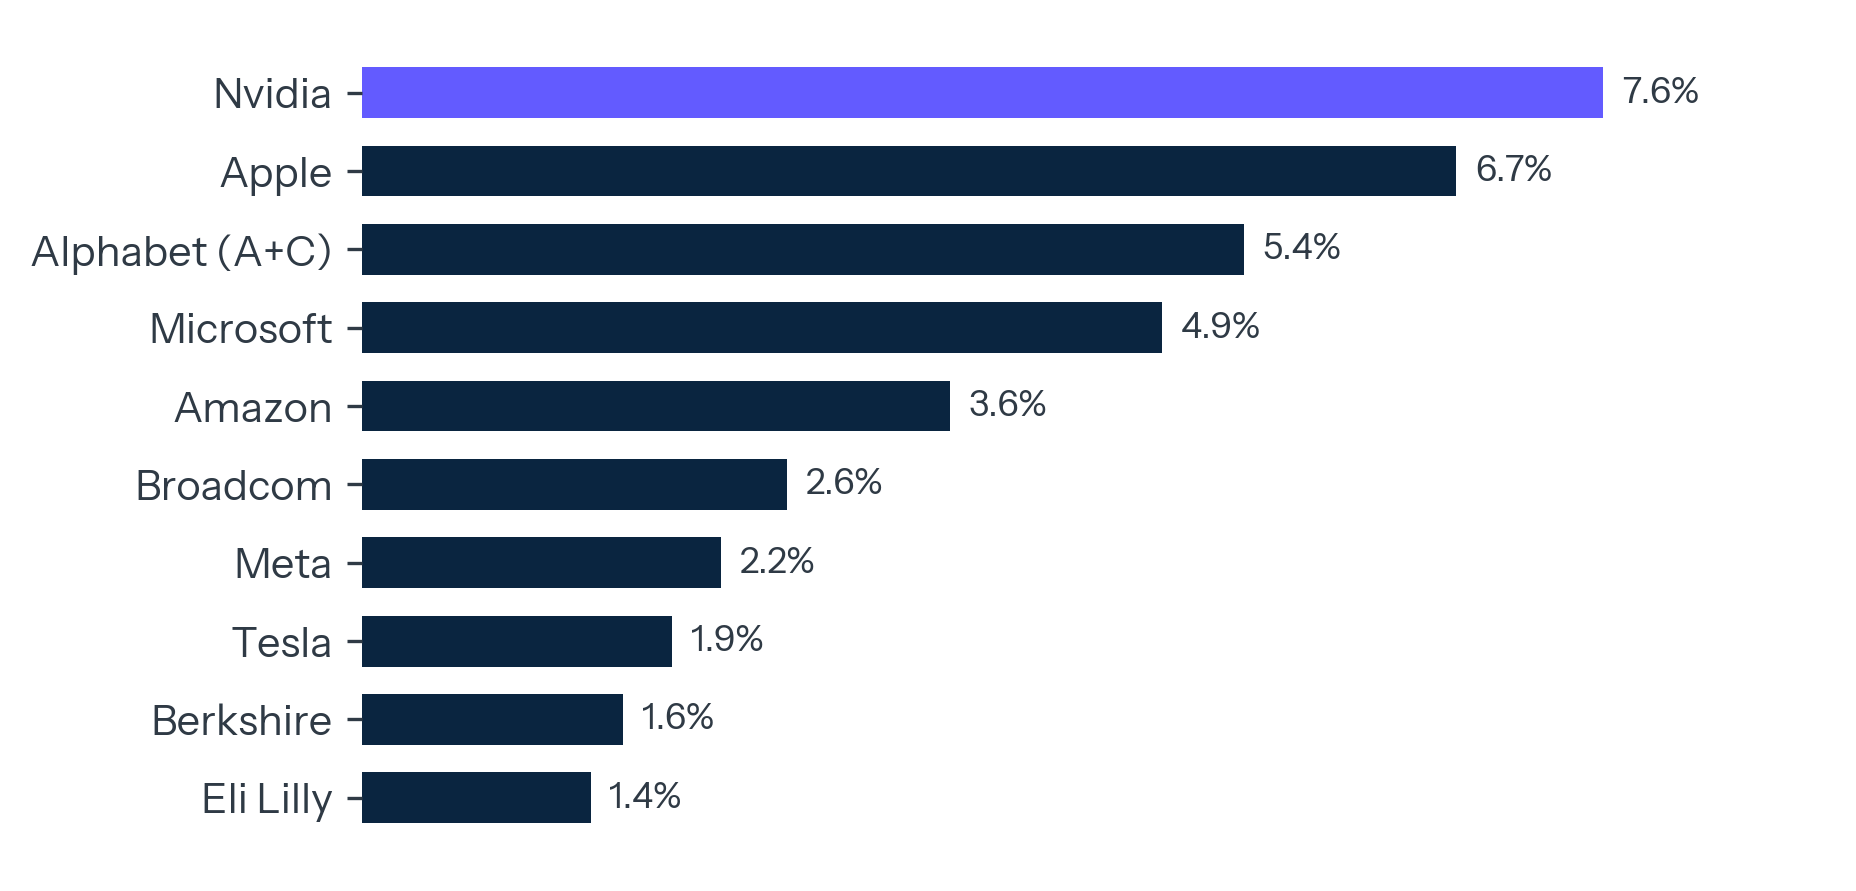
Source: Slickcharts, S&P 500 Companies by Weight, March 31, 2026.
For price discovery. The ECB's empirical finding compounds across the nine-percentage-point rise in median passive ownership since 2010. The cumulative correlation effect, approximately 0.045, makes the index less able to differentiate among its components. Capital therefore does not flow efficiently to its highest-value uses within the public markets. The Jiang, Vayanos, and Zheng (2025) finding that the largest stocks are valued in excess of fundamentals points to the same conclusion. Public equity markets, the cleanest price-discovery institution in the American economy, are losing the function in proportion to passive ownership growth.
For the hyperscaler dependence. Three companies, Alphabet, Amazon, and Meta, contributed approximately 71 percent of the GAAP Q1 2026 S&P 500 net dollar earnings increase, though substantially less on an adjusted operating basis as the earnings decomposition above shows. See Exhibit 6. The dependence is real on both measures. A single guide-down at any of the three, on either operating or reported earnings, produces an index-level reaction with no analog in prior cycles. The reaction is amplified by passive flows that move proportionally to weight, with no offsetting active conviction. Sovereign wealth funds with index-tracking mandates, including Norway's $2 trillion Government Pension Fund Global, inherit the exposure mechanically.
EXHIBIT 6: Seventy or Thirty
Trio share of Q1 2026 S&P 500 net dollar earnings increase: GAAP (reported) vs. adjusted for one-time items.
Source: FactSet Earnings Insight, May 1 and May 8, 2026; company filings (Alphabet, Amazon, Meta Q1 2026); Power Curve calculations on like-for-like adjusted basis.
For active management. The cyclical case for active managers has weakened steadily over a decade. Only 38 percent of US active funds beat their passive benchmarks in 2025. Over ten years, only 21 percent both survived and outperformed.20 The structural case has strengthened in the same period. A market in which passive flows distort price discovery is one in which fundamental analysis has greater latent value. The challenge for active managers is that the value materializes principally during regime transitions, which the prevailing flow data have not yet confirmed.
For institutional allocators. The 38-percent concentration figure has specific consequences for the construction of diversified equity allocations. A target allocation of 60 percent to US equities, benchmarked to the S&P 500, translates today into approximately 23 percent of total portfolio exposure to the top ten names and approximately 19 percent to the seven AI-adjacent hyperscalers alone. Allocators whose mandates were written before 2022 have drifted into concentrations their guidelines would not have permitted at adoption. The remediation options are limited. Equal-weighted overlays raise tracking error and active risk; explicit underweights to the top names introduce the active management challenges discussed above. Most institutional allocators have, in practice, accepted the concentration drift as an artifact of passive benchmarking rather than treating it as a portfolio risk to manage.
What to Watch
The relationship between the Invesco Equal Weight ETF and the SPDR S&P 500 ETF, on a rolling 90-day basis, is the cleanest real-time indicator of whether the AI premium is widening or compressing. The four-percentage-point gap in 2026 year-to-date is small in historical terms but directionally meaningful. A sustained 90-day gap above five percentage points would indicate the unwind has entered a self-reinforcing phase.
Watch consensus earnings revisions for Alphabet, Amazon, and Meta, on both reported and adjusted measures, and the level expectations for Nvidia. The 71 percent share of the GAAP Q1 2026 net dollar earnings increase concentrated in three companies, layered atop Nvidia's status as the single largest 2026 EPS contributor, leaves the index acutely exposed to disappointments at any one of them, even after the adjusted-basis discount. The relevant data are the consensus FY2026 EPS estimates as reported by FactSet, Bloomberg, and Refinitiv, both as reported and adjusted for the kinds of one-time items that drove the Q1 surprises. The estimates converge tightly when underlying businesses are performing and disperse when management commentary turns ambiguous.
Watch ICI monthly active and passive flow data. If active inflows resume, the price-discovery engine begins to repair, and the mean-reversion that began in early 2026 could accelerate. If passive flows continue and active flows do not return, the structural conditions that produced the 38-percent company-aggregated concentration remain in place, and the equal-weight outperformance will reverse when the AI earnings narrative reasserts itself.
Watch AI capital expenditure guidance from the four largest hyperscalers. Following the Q1 2026 prints, Alphabet, Amazon, Meta, and Microsoft have collectively guided to approximately $700 billion of capital spending in calendar 2026, roughly double the four companies' approximately $350 billion of capital expenditure in 2025.21 The valuation premium embedded in their equity prices, and by extension in the broader index, rests on the assumption that this capex cycle will translate into sustained earnings growth at scale. A meaningful downward revision to capex guidance, or a clear pattern of capex outpacing realized enterprise revenue traction, would compress the multiples on which the top-ten concentration depends. The relevant signal is the quarterly earnings call commentary on AI revenue conversion and unit economics, not the headline capex number itself.
The deeper issue is structural and is not waiting on any single indicator. The Investment Company Institute's data confirm that a majority of Americans' equity exposure now sits in vehicles that do not exercise judgment about what they own. The growth of those vehicles has produced an index more concentrated than at the worst of the dot-com bubble. The academic research confirms the mechanism. The 2026 equal-weight reversal is the first hint that the system is testing the limits of how much concentration it can sustain. The position is widely held, often through default vehicles, and rarely reviewed against the criteria a fund of similar concentration would face from an institutional risk committee. Three facts in combination characterize the situation. The S&P 500's top ten companies hold a higher share of index weight than at any point in modern history. Most American households are exposed to that concentration through retirement vehicles they did not design. The mechanism that produced the concentration runs in both directions, and the empirical signature of its reversal is now four months old. The next test of how much concentration the system can sustain may not announce itself in advance, but the conditions for the test are already in place.
Notes
- RBC Wealth Management, "The Great Narrowing: S&P 500 Concentration," 2024. ↩
- FactSet historical S&P 500 weighting data, cited in RBC Wealth Management and Tema ETFs analyses, 2024-2026. ↩
- Slickcharts, "S&P 500 Companies by Weight," as of March 31, 2026; Benzinga, "Just 10 Stocks Now Make Up Over 40% of S&P 500," May 21, 2026; Financial Symmetry/S&P historical data. Top-10 line items sum to 36.5 percent; company-aggregated (Alphabet share classes merged) reaches approximately 38 percent. ↩
- Slickcharts, March 31, 2026. ↩
- Citywire, "Passive Funds' AUM Eclipses Actives for First Time," January 2024. ↩
- Investment Company Institute, Active and Index Investing Release, March 2026. ↩
- Goldman Sachs, "Passive Ownership of the S&P 500 and Its Impact on Company Valuation," November 1, 2024. ↩
- Jiang, H., Vayanos, D., Zheng, L., "Passive Investing and the Rise of Mega-Firms," Review of Financial Studies, Vol. 38, Issue 12, December 2025, pp. 3461-3496. ↩
- Etula, E., Rinne, K., Suominen, M., Vaittinen, L., "Dash for Cash: Monthly Market Impact of Institutional Liquidity Needs," Review of Financial Studies, Vol. 33, Issue 1, January 2020, pp. 75-111. ↩
- Goldman Sachs, November 1, 2024. ↩
- European Central Bank, Financial Stability Review, "Passive Investing and Its Impact on Return Co-Movement, Market Concentration and Liquidity in Euro Area Equity Markets," November 2024. ↩
- Alex Chinco (Baruch College) and Marco Sammon (Harvard Business School), "The Passive-Ownership Share Is Double What You Think It Is," Journal of Financial Economics, Vol. 157, July 2024, article 103889. ↩
- Goldman Sachs Q4 2025 US Equity Research; JPMorgan Asset Management, Guide to the Markets, December 31, 2025. ↩
- FactSet Earnings Insight, May 1 and May 8, 2026 (Alphabet, Amazon, and Meta accounted for 71 percent of the net dollar increase in S&P 500 earnings during the Q1 2026 reporting season); Benzinga, May 2026 (citing FactSet data); Charles Schwab, On Investing podcast, May 2026; 24/7 Wall St., "Just 3 Companies Drive 70% of S&P 500's 2026 Growth Expectations," May 12, 2026. Q1 2026 reported results from company filings: Alphabet 8-K and 10-Q, April 29, 2026 ($36.9B equity-securities gain disclosed on the equity-securities line; total other income net was $37.7B); Amazon Q1 2026 press release, April 29, 2026 (approximately $16.8B Anthropic mark-to-market gain); Meta Q1 2026 press release, April 29, 2026 ($8.03B one-time tax benefit attributable to IRS Notice 2026-7, the additional interim Corporate Alternative Minimum Tax guidance issued February 18, 2026, addressing previously capitalized Section 174 R&E expenditures; see also KPMG and Sullivan & Cromwell tax notes on the notice, February 2026); TKer, "Q1 2026 GAAP earnings boosted by investment gains," May 2026. ↩
- Investment Company Institute, Q4 2025 Retirement Market Data; ICI 2025 Fact Book, 2025. ↩
- ICI 2025 Fact Book, 2025. ↩
- Morningstar Direct, US ETF Landscape data, 2025; Investment Company Institute, 2025 Investment Company Fact Book (Chapter on ETFs and US Issuer Concentration); Goldman Sachs, "Passive Ownership of the S&P 500," November 1, 2024 (for the combined Big Three voting share of S&P 500 market capitalization). ↩
- PortfoliosLab; ETFCentral; 24/7 Wall St., "3 Equal-Weight ETFs Outpacing the S&P 500 in 2026," April 9, 2026. ↩
- S&P Dow Jones Indices, "20 Years of the S&P 500 Equal Weight Index," research publication, 2023 (backtested equal-weight series 2000-2002); Jeremy J. Siegel, "The Nifty-Fifty Revisited: Do Growth Stocks Ultimately Justify Their Price?" Journal of Portfolio Management, Summer 1995; standard historical data on S&P 500 IT sector drawdown March 2000 to October 2002. ↩
- Morningstar, US Active/Passive Barometer Year-End 2025. ↩
- Company guidance aggregated from Q1 2026 earnings calls; Yahoo Finance, "Hyperscalers Hit $700 Billion in 2026 AI Spending Plans," February 2026; UBS Equity Research, Hyperscaler Capex Outlook, February 2026. ↩