The economic shocks that define modern American memory are routinely compared as if they were different intensities of the same event. The Great Depression, the stagflation of the 1970s, and COVID-19, in fact, damaged the economy through different channels, on different time horizons, and made different demands of the state. The Depression cut output to the bone over years. The 1970s combined a weak economy with accelerating prices, which forced policymakers into a choice they did not have in 1932. COVID interrupted activity within weeks and reversed itself almost as quickly. Collapsing those three episodes into a single severity scale is the most common error in macroeconomic commentary, and in 2026, it has become an expensive one.
The reason it is expensive now is fiscal. The federal balance sheet that absorbed the COVID shock in 2020 cannot absorb a comparable shock today on the same terms. Debt service is crowding discretionary spending, the political coalition that authorized the 2020 rescues has fractured, and the Federal Reserve operates with a thinner credibility margin than it did five years ago. Whether the state can respond at all to the next downturn depends on which kind of shock it turns out to be — and the standard analytical vocabulary obscures exactly that question. The wrong yardstick is no longer an academic concern but a planning one.
Framing the Critical Issues
This report uses three measurements that are usually conflated and should not be.
The first is depth: how far real output falls from its prior peak, best read in annual data. The Depression has no postwar rival on this measure. The second is duration: how long output stays below that peak, and how persistently the underlying balance sheets, labor markets, and price expectations remain damaged. Duration is what turns a recession into a regime, and it is the dimension on which the 1970s most clearly stand out. The third is speed: the rate at which the collapse and the recovery happen. Speed is invisible in annual data, decisive in quarterly data, and the dimension on which COVID is unique.
The standard "worst since the Depression" framing collapses these three into one number, which they cannot be. A shock can be deep without being abrupt. It can be abrupt without leaving lasting damage. It can be shallow in terms of output, and still be the most structurally difficult episode of its era to manage. The historical comparison only becomes useful once each axis is held separately.
The Cumulative Shock
The Depression remains the benchmark because it was severe on all three axes simultaneously and then compounded year after year. Annual real GDP fell 8.5 percent in 1930, 6.4 percent in 1931, and 12.9 percent in 1932, and contracted again in 1933.[1] Measured in chained 2017 dollars, output fell from roughly 1,191 billion in 1929 to 877 billion in 1933 — a peak-to-trough loss of more than a quarter of national production.[2] Unemployment reached 25.6 percent in May 1933.[3] The price level itself fell roughly 10 percent in 1932 alone.[4] The recovery that began in 1934 was real but fragile, and a second contraction in 1938 pushed output back below the 1929 line until late in the decade.
The numbers describe depth, but the mechanism was something larger. The Depression was a multi-year compression in which bank failures destroyed deposits, the loss of deposits destroyed spending, the loss of spending destroyed firms, and the loss of firms destroyed employment, which then fed back into more bank failures. The state watched the spiral run because it had almost nothing capable of stopping it: no deposit insurance until 1933, no unemployment system worth the name, no coherent monetary framework, no fiscal stabilizer of meaningful scale, and no political consensus to build any of it quickly enough.
What sets the 1930s apart in the modern record is the combination of a deep shock with a state structurally unequipped to absorb it. That is the configuration the postwar institutional architecture — the Fed, the FDIC, Social Security, automatic stabilizers, the modern Treasury market — was built to prevent. It is also the configuration most analysts assume cannot recur, an assumption worth interrogating in 2026.
The Inflationary Squeeze
The 1970s have always sat awkwardly in this comparison because the headline output numbers are unimpressive. Annual real GDP fell only 0.5 percent in 1974, 0.2 percent in 1975, and again by 0.3 percent in 1980 and by 1.8 percent in 1982.[1:1] Quarterly contractions of −3.7 percent in 1974 Q3 and −4.8 percent in 1975 Q1 were painful but unremarkable in postwar context.[5] On output alone, the decade looks like a stretch of disappointing recessions rather than a historic episode.
The damage was elsewhere. Annual CPI inflation reached 11.1 percent in 1974 and 13.5 percent in 1980.[6] Energy prices ran 33.7 percent above their prior-year level by September 1974.[7] Unemployment hit 9.0 percent in May 1975 and 10.8 percent in late 1982.[3:1] The combination of weak growth, rising joblessness, and accelerating prices was qualitatively different from anything the postwar stabilization toolkit had been designed to handle. The OPEC embargo had repriced energy across the entire economy, productivity growth had slowed, and inflation expectations had drifted high enough that the public no longer treated price stability as the default state of the world.
That combination matters more than the output figures because it changes what stabilization policy can do. A demand collapse is, in principle, the kind of problem the postwar Fed and Treasury were built to neutralize. A supply repricing is harder. It forces policymakers to choose between stabilizing prices and accepting a deeper recession, or stabilizing output and accepting that inflation will become entrenched. Volcker eventually chose the first, and the unemployment rate paid for that choice from 1979 through 1982. The decade is best read not as a uniquely deep recession but as the only episode in the modern record in which the state had its full toolkit and still could not use it without triggering a second downturn.
The Sudden Stop
COVID is the episode that public commentary most often compares to the Depression, and that comparison most consistently misleads. Annual data make the recession look modest: real GDP fell 2.1 percent in 2020 and rebounded 6.2 percent in 2021.[1:2] On annual numbers alone, the episode is unremarkable. Annual numbers, however, are the wrong frame.
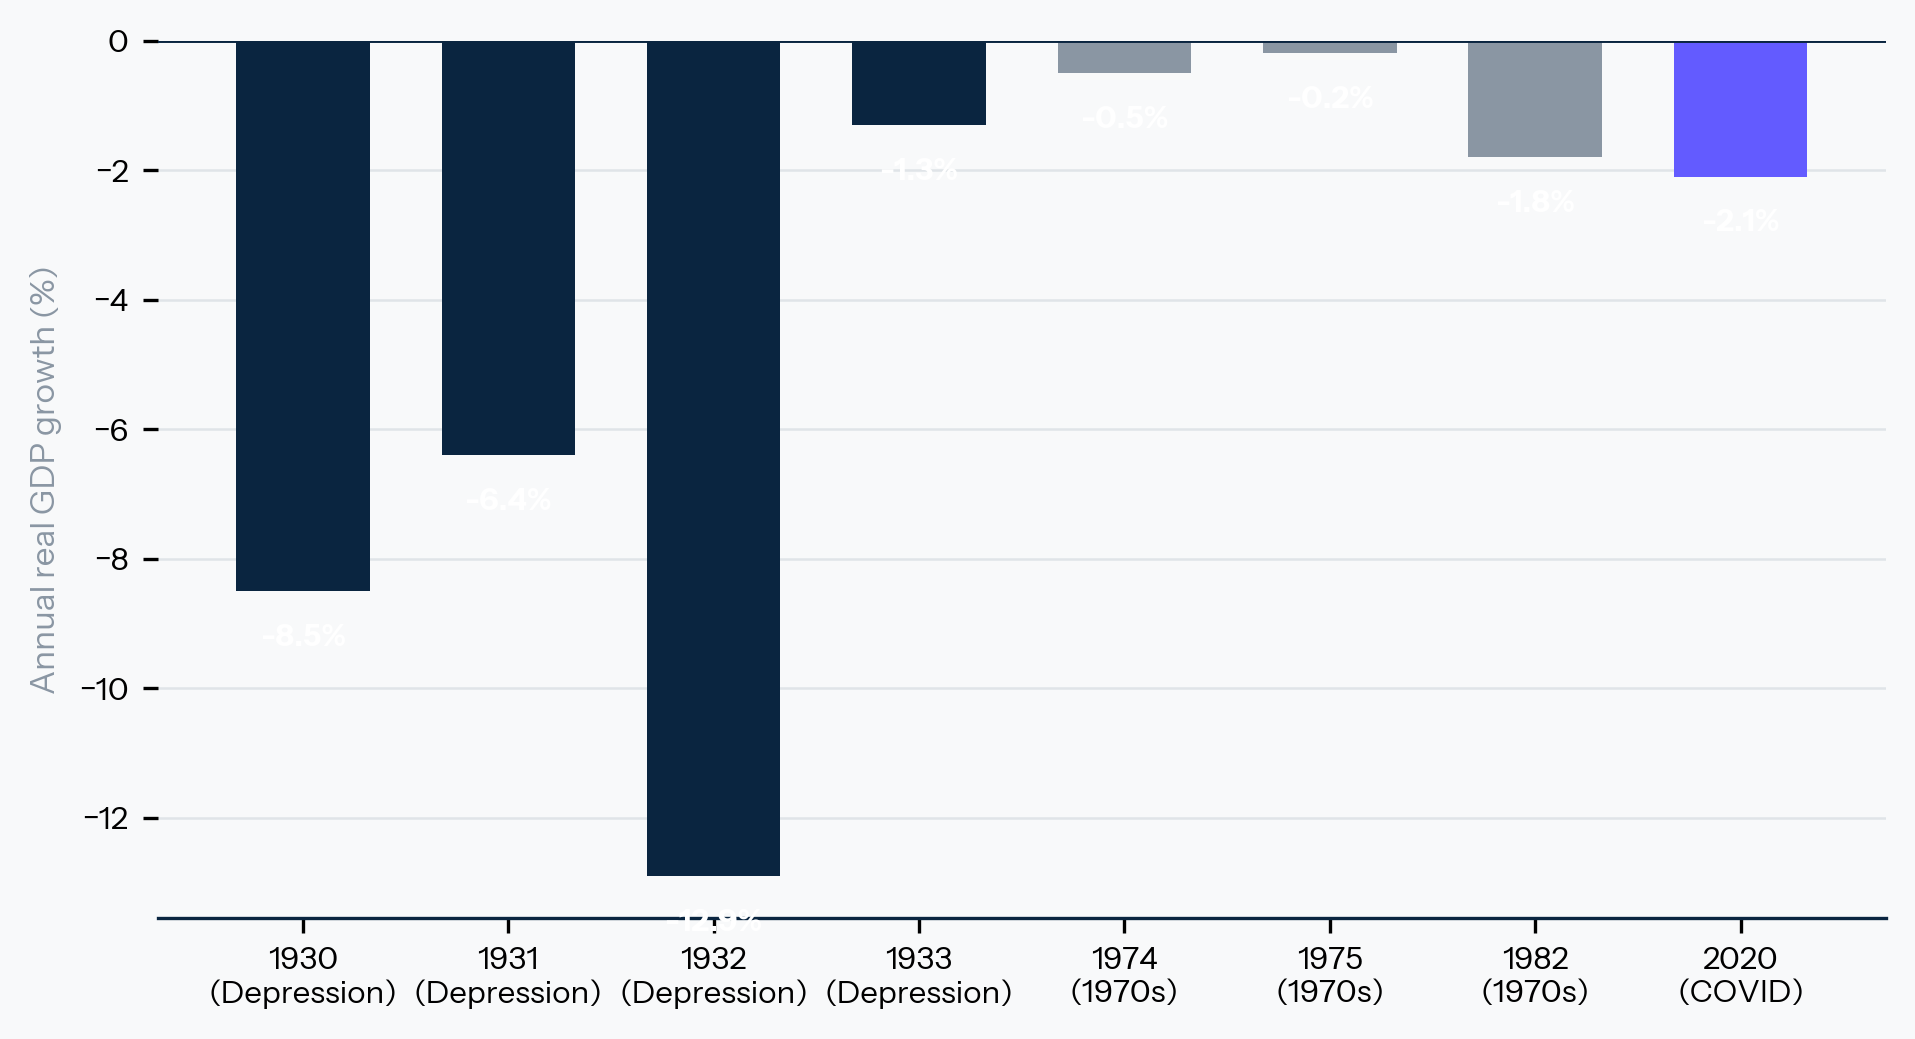
Exhibit 1: Depth: annual real GDP growth, three episodes
The Depression dominates annual output damage. The 1970s show repeated disappointments rather than a singular collapse. COVID barely registers in annual data.
Quarterly data show what households and firms actually lived through. Real GDP contracted at a −5.2 percent annualized rate in 2020 Q1 and −28.0 percent in 2020 Q2, then rebounded 34.9 percent in 2020 Q3.[5:1] The NBER dates the recession from February to April of 2020, the shortest in its chronology. Unemployment jumped from 3.5 percent in February to 14.8 percent in April.[3:2] Quarterly real GDP exceeded its 2019 Q4 level by 2021 Q2.[8] The collapse and the recovery were both compressed into a window that no prior modern shock approaches.
The other reason the 2020 episode looks abrupt rather than catastrophic is that the state intervened on a scale without precedent. The CARES Act, the Paycheck Protection Program, expanded unemployment benefits, direct cash transfers, and a Federal Reserve balance sheet expansion of historic magnitude converted what could have plausibly become a Depression-grade liquidity event into a sharp interruption that proved largely reversible once public health restrictions lifted. The shock itself was real, but the recovery profile is mostly a measure of how aggressively and how quickly the state absorbed it.
Reading 2020 as "the worst since the Depression" therefore captures the depth of the quarterly print and misses the mechanism that produced the recovery. The Depression was a prolonged failure of demand and credit transmission against a state that could not respond at scale; COVID was a mandated shutdown of activity against a state that could and did. The comparison most worth carrying out of the COVID experience is not that the modern economy is fragile but that the modern economy is policy-buffered, and that the buffer is expensive enough that it cannot be assumed to remain available indefinitely.
The three exhibits found here do not rank the episodes against one another. They unbundle them. Read together, they make the case that depth, speed, and duration are different damages, each requiring a different stabilization toolkit, and that the habit of grading shocks on a single severity scale obscures the variable that matters most: which mechanism is at work.
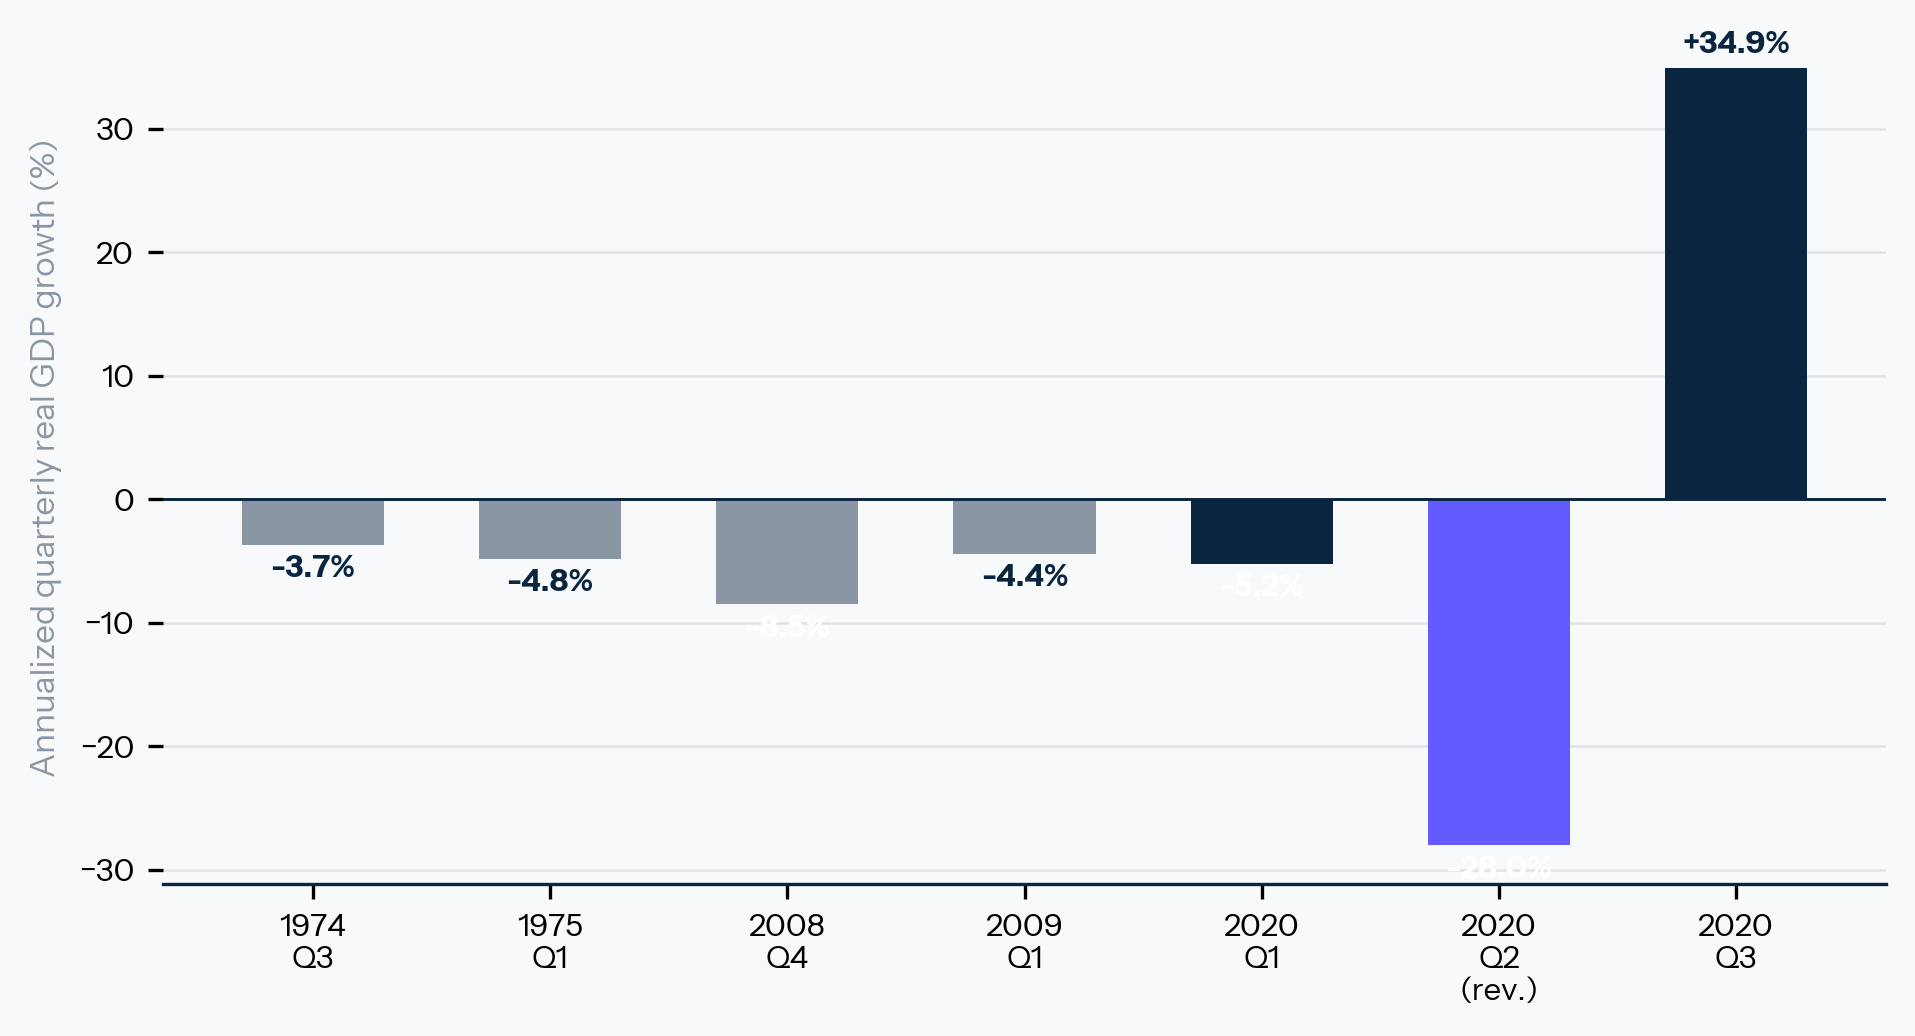
Exhibit 2: Speed: quarterly real GDP contractions, postwar
The −28.0 percent print in 2020 Q2 sits in a category by itself. The 1970s contractions, painful as they were, occupy an entirely different distribution.
The Fiscal Constraint
This is where the analysis turns toward 2026, because the variable that has changed most since the last downturn is the state's room to maneuver.
The COVID response was possible because the United States entered 2020 with fiscal credibility broadly intact, debt service that had not yet crowded out discretionary outlays, and a political coalition that, under emergency conditions, could authorize a multi-trillion-dollar rescue within a month. None of those conditions hold cleanly today. Federal interest costs have moved past the defense budget. The bipartisan consensus that produced the CARES Act has visibly fractured. The Federal Reserve, having spent down its inflation credibility once already on the post-2021 disinflation, faces a narrower margin for the kind of balance-sheet expansion it executed in March 2020. The central bank still has its tools, but each one carries a higher political and credibility cost than it did five years ago, and the fiscal authority has fewer of them than it had then.
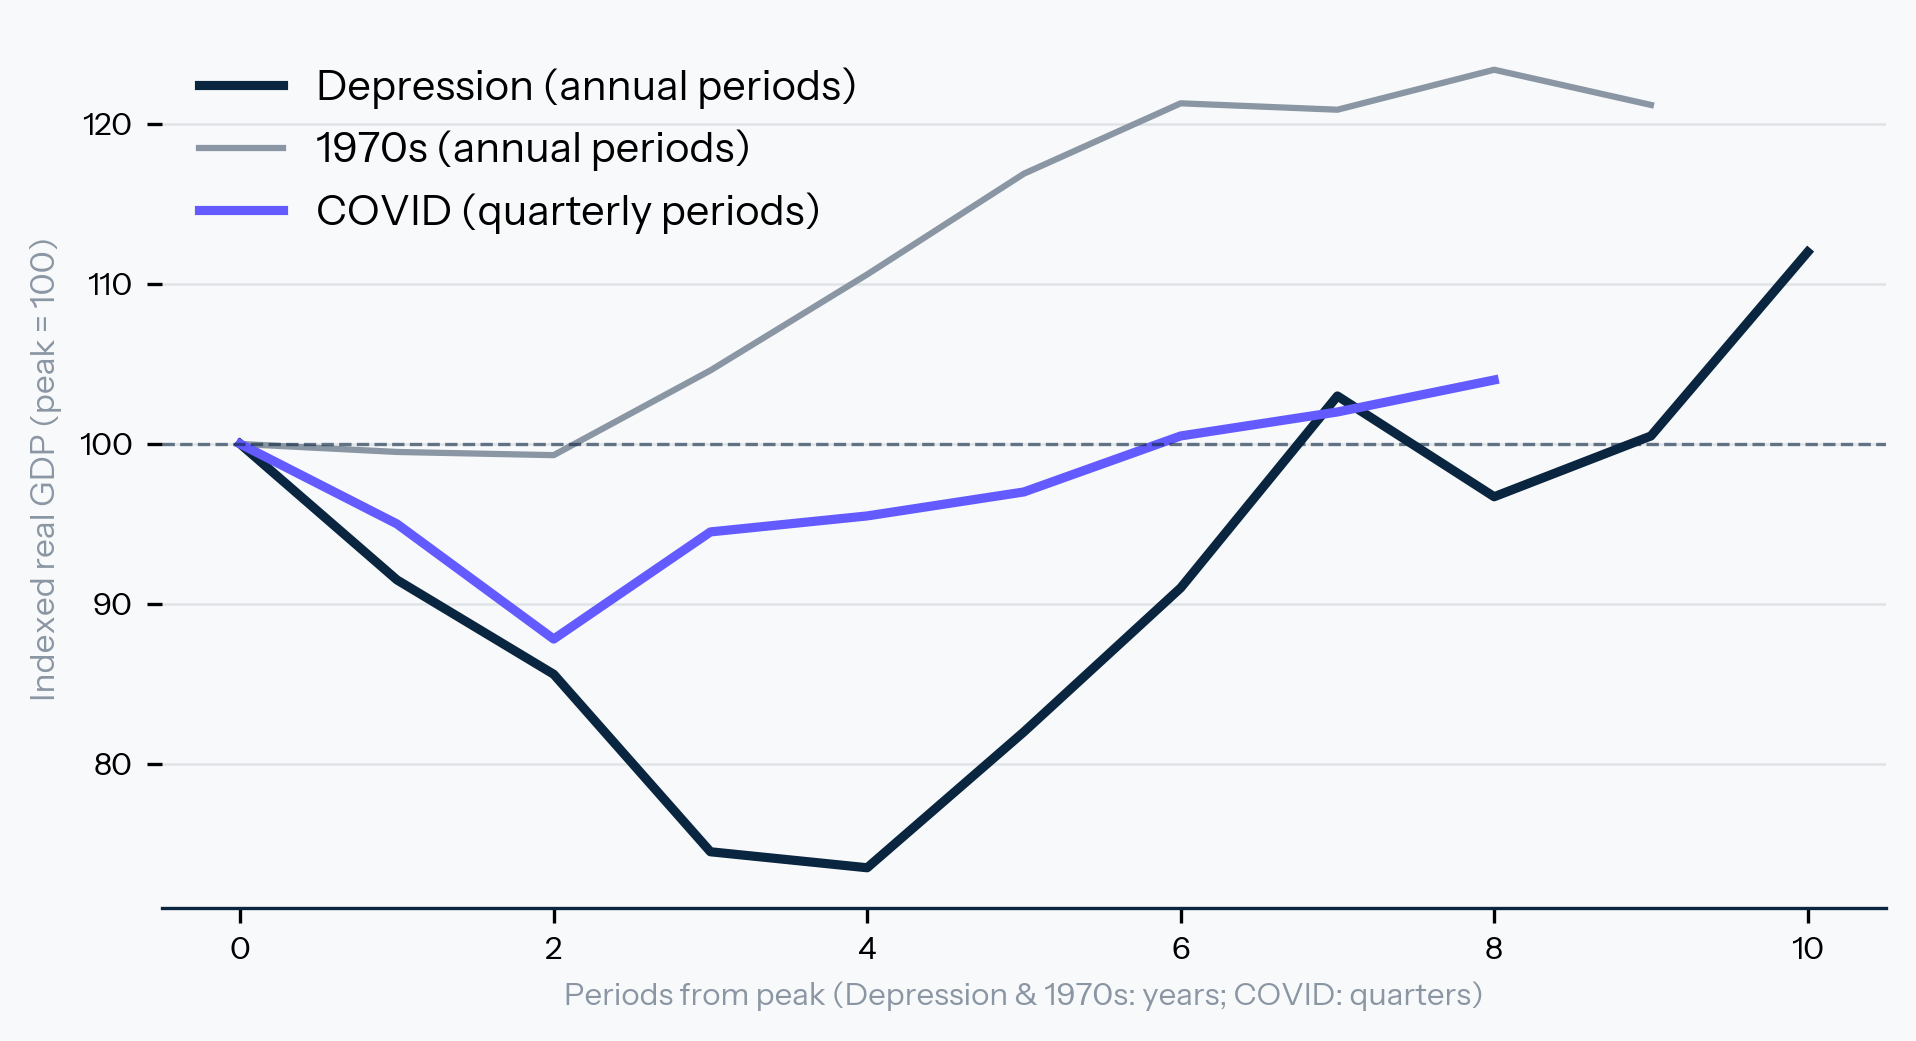
Exhibit 3: Duration: indexed real GDP, peak = 100
Depression output stayed below peak for years. The 1970s recovered in roughly two. COVID recovered in five quarters.
In a world of constrained state response, the mechanism of the next downturn matters more than its headline depth. A demand collapse of the 1930s type would test a fiscal authority that can no longer respond at the 2020 scale without provoking the bond market and stalling in a fractured Congress. A supply repricing of the 1970s type would test a Federal Reserve that does not have a second Volcker disinflation in its credibility budget. A sudden shock, of the COVID type, would test a political system that has visibly lost its consensus on emergency rescue. Each of the three historical mechanisms is now harder to neutralize than it was the last time it appeared, and there is no reason to assume the next shock will arrive in the form the system is best prepared to handle.
Implications
Several implications follow for anyone making decisions on a 2026 horizon.
Allocators and risk managers should stop relying on annual output as their primary measure of recession severity. The next downturn will be misjudged in real time if depth, speed, and duration are collapsed into a single number. Liquidity planning, covenant exposure, and labor-cost flexibility deserve to be stress-tested separately against each axis rather than against one composite recession scenario. The 2020 experience showed that quarterly speed can outrun annual data by an order of magnitude. The 1970s experience showed that an inflation regime can do more damage to a balance sheet than a deeper but cleaner contraction.
Policymakers and boards should treat the 1970s, rather than the 1930s, as the most relevant historical analog for the most plausible next shock. The combination of constrained fiscal capacity, contested monetary credibility, and persistent supply-side fragility — running through energy, semiconductors, critical minerals, and AI compute — looks more like the political economy of 1974 than like the institutional vacuum of 1932. The hard problem in such an environment is not the absence of tools. It is the rising cost of using the ones that exist.
Anyone modeling state response should price in a smaller, slower fiscal reaction than in the 2020 baseline. A second CARES Act is not within the operating envelope of the current Congress, and the bond market would price its arrival differently than it did five years ago. Recovery speeds in any future shock should be discounted accordingly, and the COVID recovery profile should be treated as the upper bound of what is now politically and financially possible, not as the new normal.
What to Watch
Three variables would confirm or weaken this thesis. The first is the share of federal outlays absorbed by debt service, which determines how much fiscal headroom remains for a discretionary response. The second is the spread between long-dated Treasury yields and the policy rate during any growth scare, which signals how the bond market is pricing the credibility of that response. The third is the speed with which Congress can authorize emergency outlays in a crisis that lacks the political clarity of a pandemic. If debt service continues to rise, term premia widen amid stress, and legislative response times lengthen, the fiscal buffer is eroding on all three fronts at once. That is the configuration in which the wrong yardstick becomes most costly.
The Depression was the deepest shock in the modern record. The 1970s were the most inflationary. COVID was the fastest. Treating these as the same kind of damage at different intensities obscures the only question that actually matters when the next downturn arrives: which mechanism is at work, and which response the state can still afford to mount.
The next shock will not announce its type. It will be read in real time against the prior episode that feels most familiar, and the cost of that comparison will be paid by whoever planned for the wrong axis. The buffer that made 2020 look manageable was never free, and it is no longer fully available.
Notes
- U.S. Bureau of Economic Analysis via FRED, annual real GDP growth, A191RL1A225NBEA. ↩︎ ↩︎ ↩︎
- U.S. Bureau of Economic Analysis via FRED, annual real GDP level, GDPCA. ↩︎
- U.S. Bureau of Labor Statistics via FRED, unemployment rate, UNRATE; NBER macrohistory series M0892AUSM156SNBR for the Depression-era figure. ↩︎ ↩︎ ↩︎
- World Bank via FRED, annual CPI inflation, FPCPITOTLZGUSA. ↩︎
- U.S. Bureau of Economic Analysis via FRED, quarterly real GDP growth, A191RL1Q225SBEA. ↩︎ ↩︎
- U.S. Bureau of Labor Statistics via FRED, CPI all items, CPIAUCNS. ↩︎
- BLS, Exploring price increases in 2021 and previous periods of inflation, on the September 1974 energy CPI peak. ↩︎
- U.S. Bureau of Economic Analysis via FRED, quarterly real GDP level, GDPC1. ↩︎