The central energy fact of 2026 is a dual production boom. China is setting the clean-power cost curve. America is setting the hydrocarbon supply curve. China is turning factories, finance, land, and transmission into renewable electricity at a pace no other economy can match. The United States is turning shale geology, drilling productivity, gas processing, and export infrastructure into record oil and gas output.
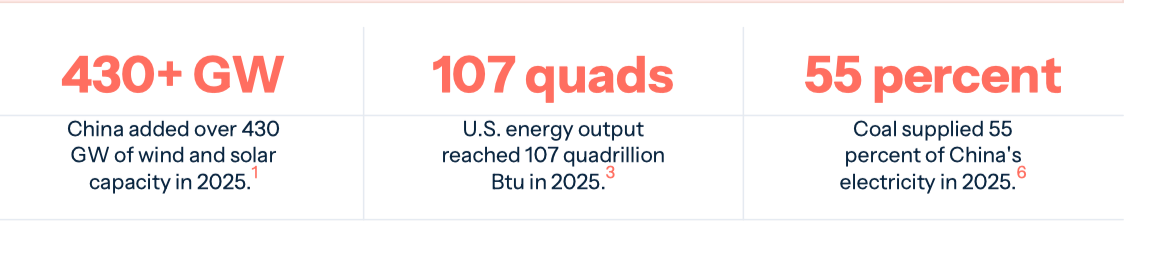
China added more than 430 gigawatts of wind and solar capacity in 2025.[1] Wind and solar reached 47.3 percent of China's total power capacity and supplied 22 percent of national electricity output.[1:1] In the same year, U.S. total energy output reached a record 107 quadrillion British thermal units, dry natural gas reached 39 trillion cubic feet, and crude oil reached 13.6 million barrels per day.[2][3] The systems differ, but the political economy is comparable. Both countries have built machines large enough to move prices, reorder supply chains, and widen strategic options beyond their own borders.
The difference is the last mile. China must turn installed capacity into reliable electricity that can replace coal generation where power is needed. America must turn record hydrocarbon output into durable advantage through export capacity, domestic price resilience, and allied supply leverage. Energy power now depends on strategic yield: how much usable power a system gets from what it can produce.
Key Judgment: The energy contest has moved from abstract fuel dominance to delivered advantage: usable power, price advantage, and geopolitical leverage. The decisive question is which production system can generate that advantage fastest.
The Core Frame
The core frame is the last-mile problem. Energy abundance matters when it becomes lower costs, greater resilience, export leverage, industrial competitiveness, or military freedom of action. Production alone is insufficient. Capacity can sit idle. Gas can be stranded. Oil can fall into a price collapse. A grid can add solar faster than it can move power across provinces. A shale basin can produce more gas than pipelines can carry. The strategic issue is how quickly each system turns headline production into useful power.
China and America have solved different first-order problems. China solved the manufacturing and deployment problem for wind, solar, batteries, inverters, and grid equipment. The result is a domestic renewable buildout that also lowers global equipment costs and gives Chinese firms the central position in clean-energy supply chains. America solved the extraction productivity problem. Horizontal drilling, hydraulic fracturing, data, private mineral rights, oilfield services, and a permissive capital cycle turned the United States into the world's largest combined oil and gas producer.
The second-order problems are harder. China must make a vast variable-power system work across geography, weather, provincial incentives, coal dispatch, power markets, and transmission bottlenecks. The United States must sustain hydrocarbon output through mature shale basins, capital discipline, environmental pressure, export commitments, and infrastructure politics. Each system has a visible boom and a hidden constraint. The hidden constraint will determine the real power dividend.
Scarcity Made Both Machines
The two booms came from different scarcity memories. China's energy policy grew out of a country that industrialized at historic speed while importing rising volumes of oil and gas, burning immense quantities of coal, and managing air pollution as a political problem. The leadership saw energy as a security input, an industrial base, and a social-stability issue. Renewable power fit that agenda because it could be built at home, manufactured by Chinese firms, financed by Chinese banks, installed by Chinese developers, and tied to a broader electrification strategy.
The United States learned the opposite lesson. Its modern energy imagination was shaped by import vulnerability, oil shocks, Middle East exposure, refinery constraints, and the long assumption that domestic production was in decline. Shale changed that psychology. The United States became a net total energy exporter in 2019 after decades of import dependence.[5] By 2025, it was producing more crude oil than Saudi Arabia or Russia and more natural gas than any other country.[2:2][6] A system once organized around scarcity became a system organized around abundance.
The historical symmetry matters because it explains why both booms have political durability. China's renewable expansion is tied to industrial policy, energy security, and technological leadership. America's oil and gas expansion is tied to jobs, royalties, exports, domestic prices, and geopolitical leverage. Each system now has constituencies that want the boom to continue. Each system also has opponents, bottlenecks, and trade-offs that become harder to manage as scale increases. The result is an energy contest with deep domestic roots. Neither boom is a slogan that can be reversed quickly by a single policy cycle.
Exhibit 1: Two Scarcity Memories, Two Production Machines
The two energy superpowers built different machines because they were solving different scarcity problems.
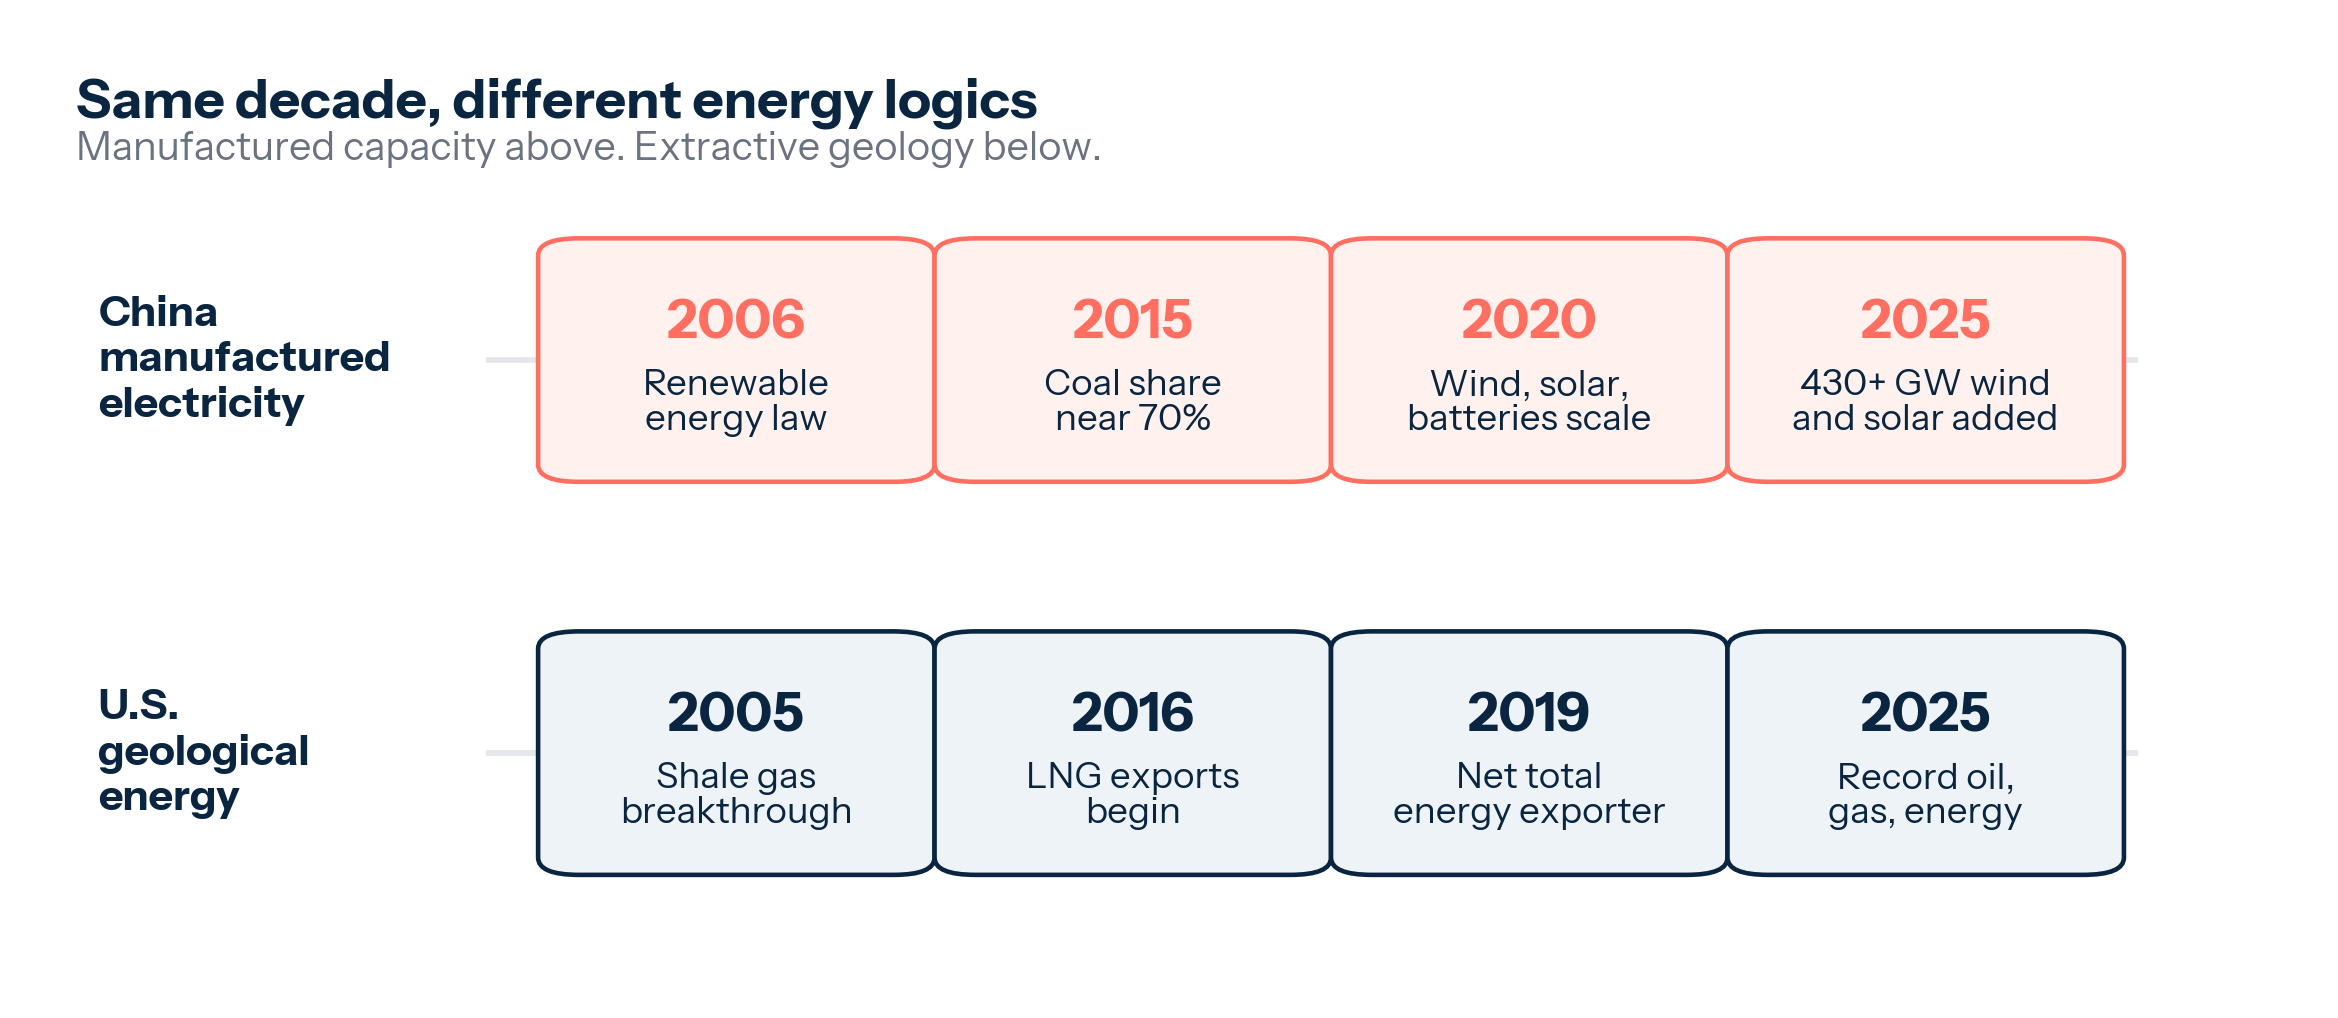
The timeline gives the comparison its historical force before the scale charts begin. The China track moves from coal-heavy industrialization to large renewable targets, manufacturing dominance, and the 2025 wind and solar surge. The U.S. track moves from import dependence to shale gas, tight oil, LNG exports, net total energy exporter status, and the 2025 production record. Both booms are answers to vulnerability. Their technologies differ because their vulnerabilities differed.
Two Booms, Two Machines
The 2025 data makes the side-by-side comparison unavoidable. China installed more than 430 gigawatts of wind and solar capacity in one year.[1:3] IEA estimates put China renewable additions even higher under its broader method, near 500 gigawatts, with nearly 370 gigawatts of solar PV and 117 gigawatts of wind.[7] That is a flow of new capability before it is a measure of delivered power. It still captures the scale of the Chinese machine. A country that can add renewable power capacity at that speed is applying the logic of manufactured goods to the power system.
America set a different kind of record. Total U.S. energy production rose to 107 quadrillion Btu in 2025, the highest level ever recorded by the Energy Information Administration.[2:3] Dry natural gas production reached 39 trillion cubic feet.[2:4] Marketed natural gas production averaged 118.5 billion cubic feet per day, also a record.[8] Crude oil production reached 13.6 million barrels per day.[3:1] U.S. energy abundance now rests on a hydrocarbon platform so large that it shapes trade balances, petrochemical feedstocks, electricity prices, LNG diplomacy, refinery flows, and the inflation response to global oil shocks.
These are different units because they are different machines. China renewable capacity is measured in watts. It produces electricity when sun, wind, transmission, storage, dispatch rules, and demand align. U.S. oil and gas are measured in barrels, cubic feet, and Btu. They are stored, shipped, refined, burned, liquefied, or used as feedstock. The comparison still matters because both booms answer the same strategic question: which countries can create energy abundance at scale while others import it, ration it, or pay volatile prices for it.
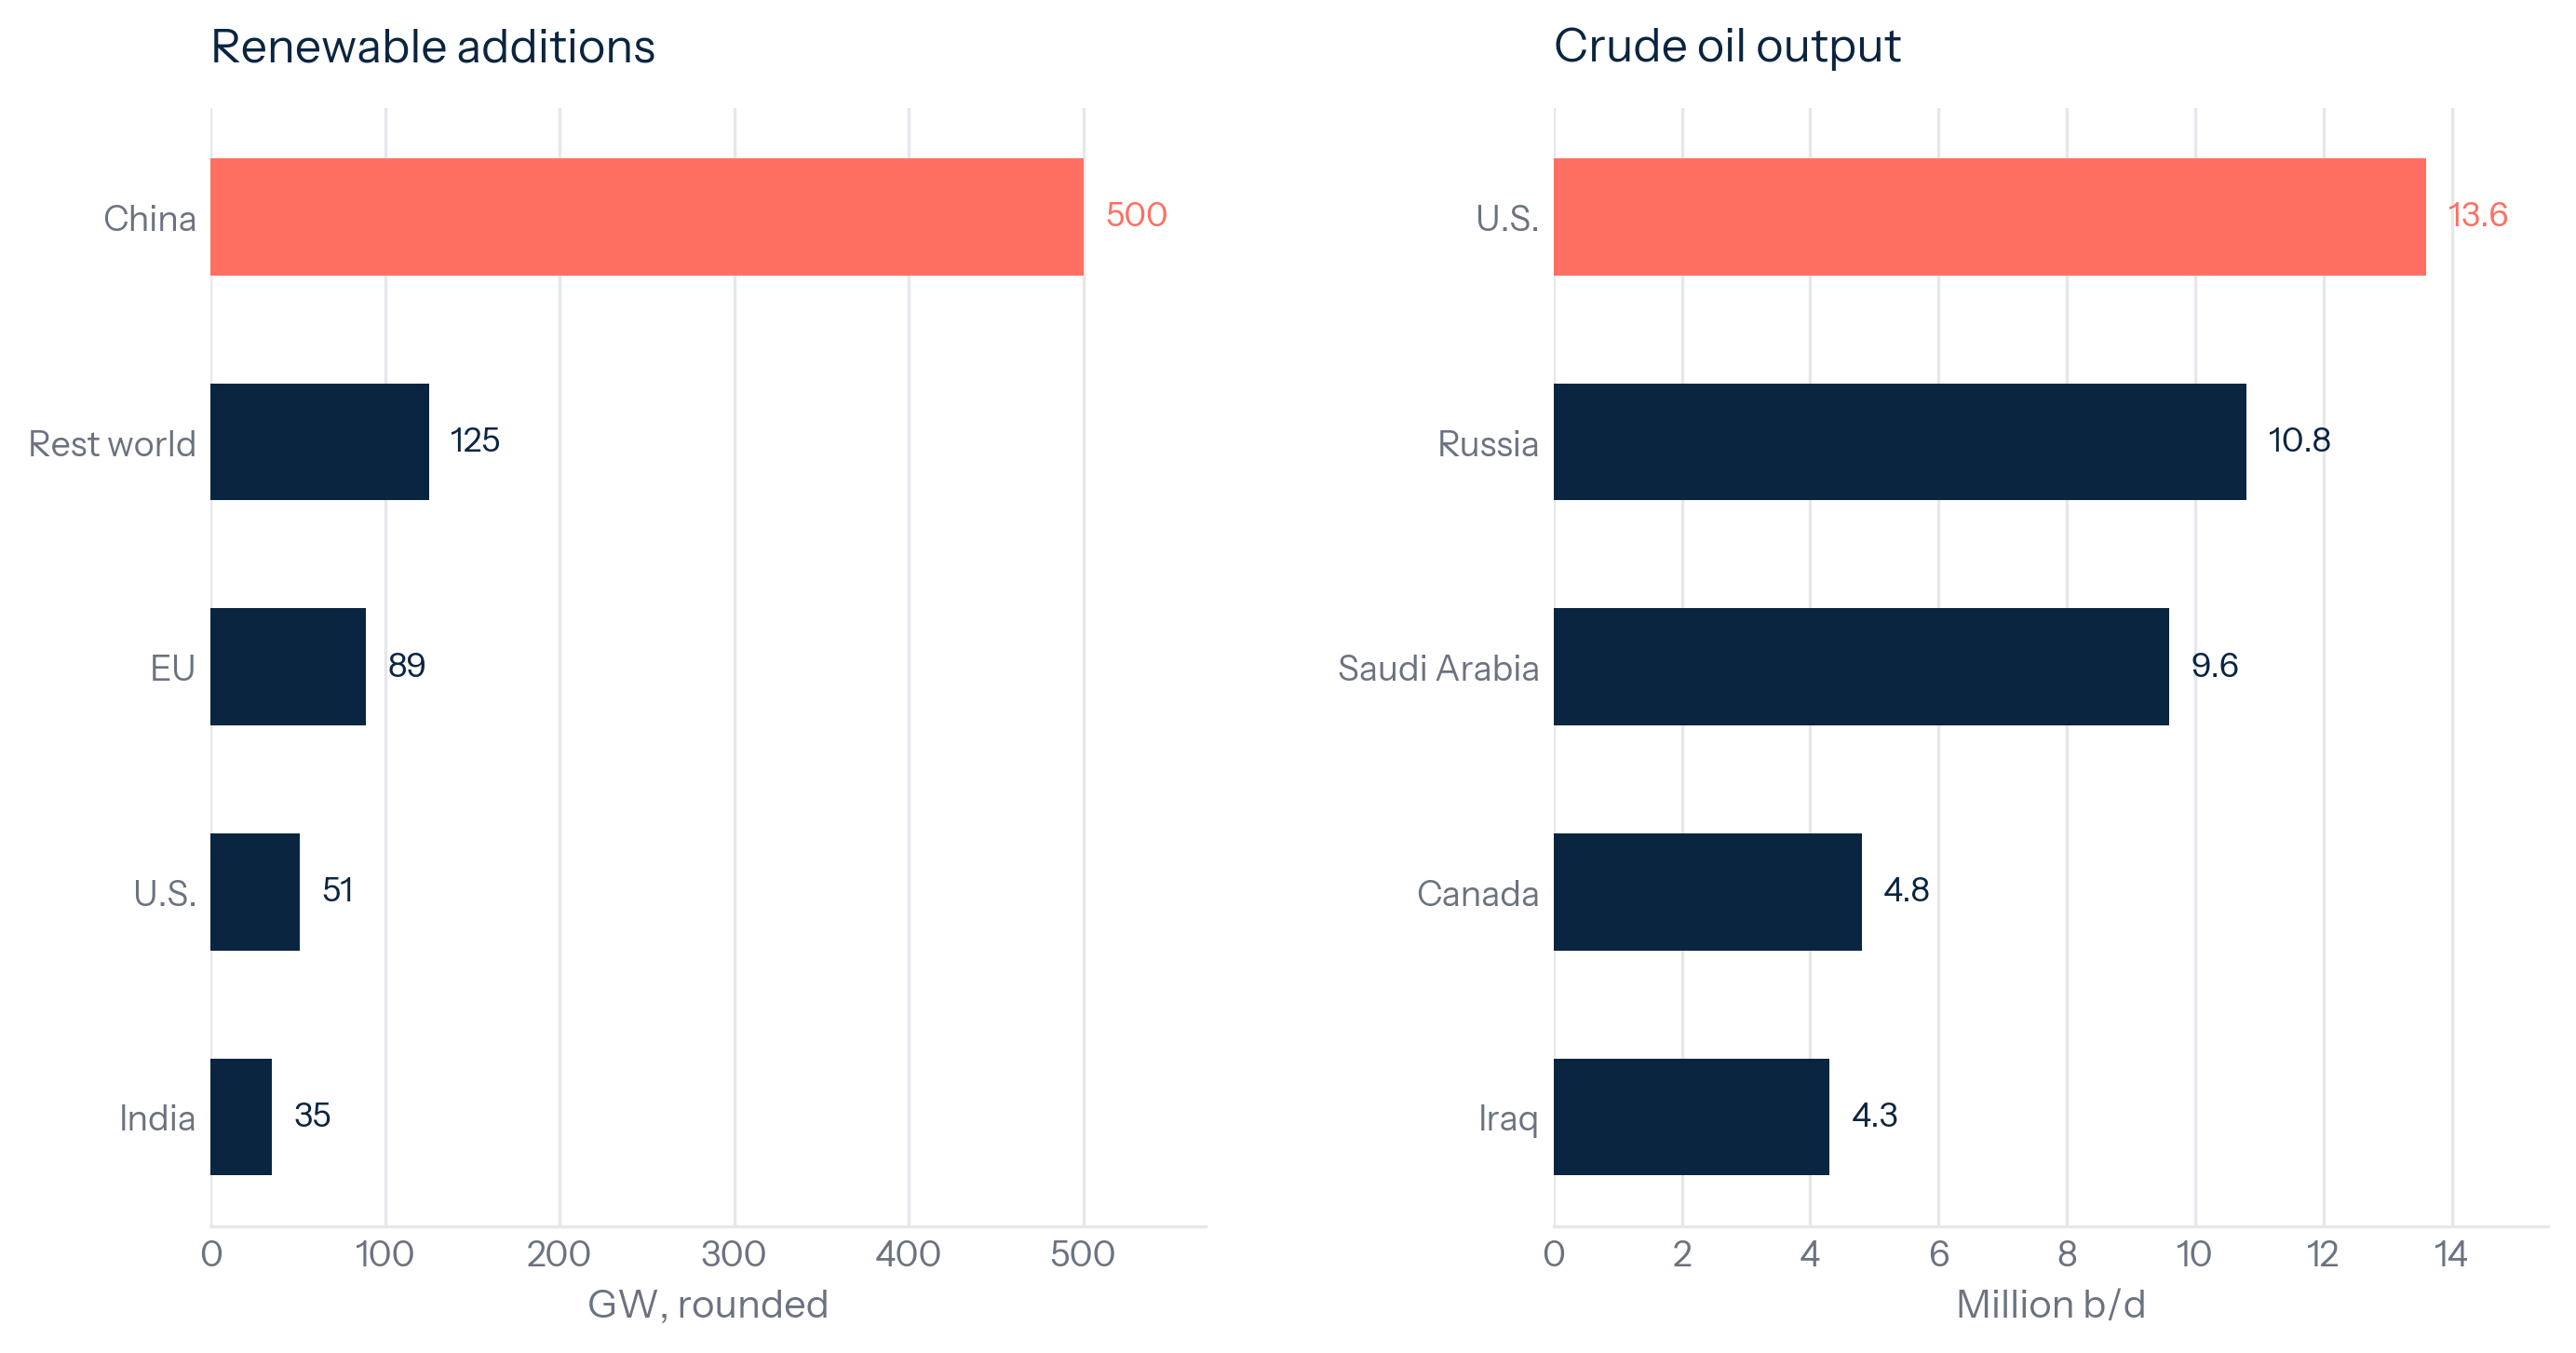
China and the United States are separating from the pack. China dominates renewable manufacturing and deployment. The United States dominates oil and gas production. Russia remains large in gas and oil. Saudi Arabia remains central in crude oil. The European Union remains a high-income power system with strong clean-energy deployment and limited hydrocarbon production. India is a growing demand center. The energy map is becoming asymmetric. The future is being shaped by countries that command different forms of supply.
Exhibit 2: Two Energy Booms, One Decade
China's deployment curve and America's shale curve show the same strategic fact: repeatable production changes energy systems fastest.
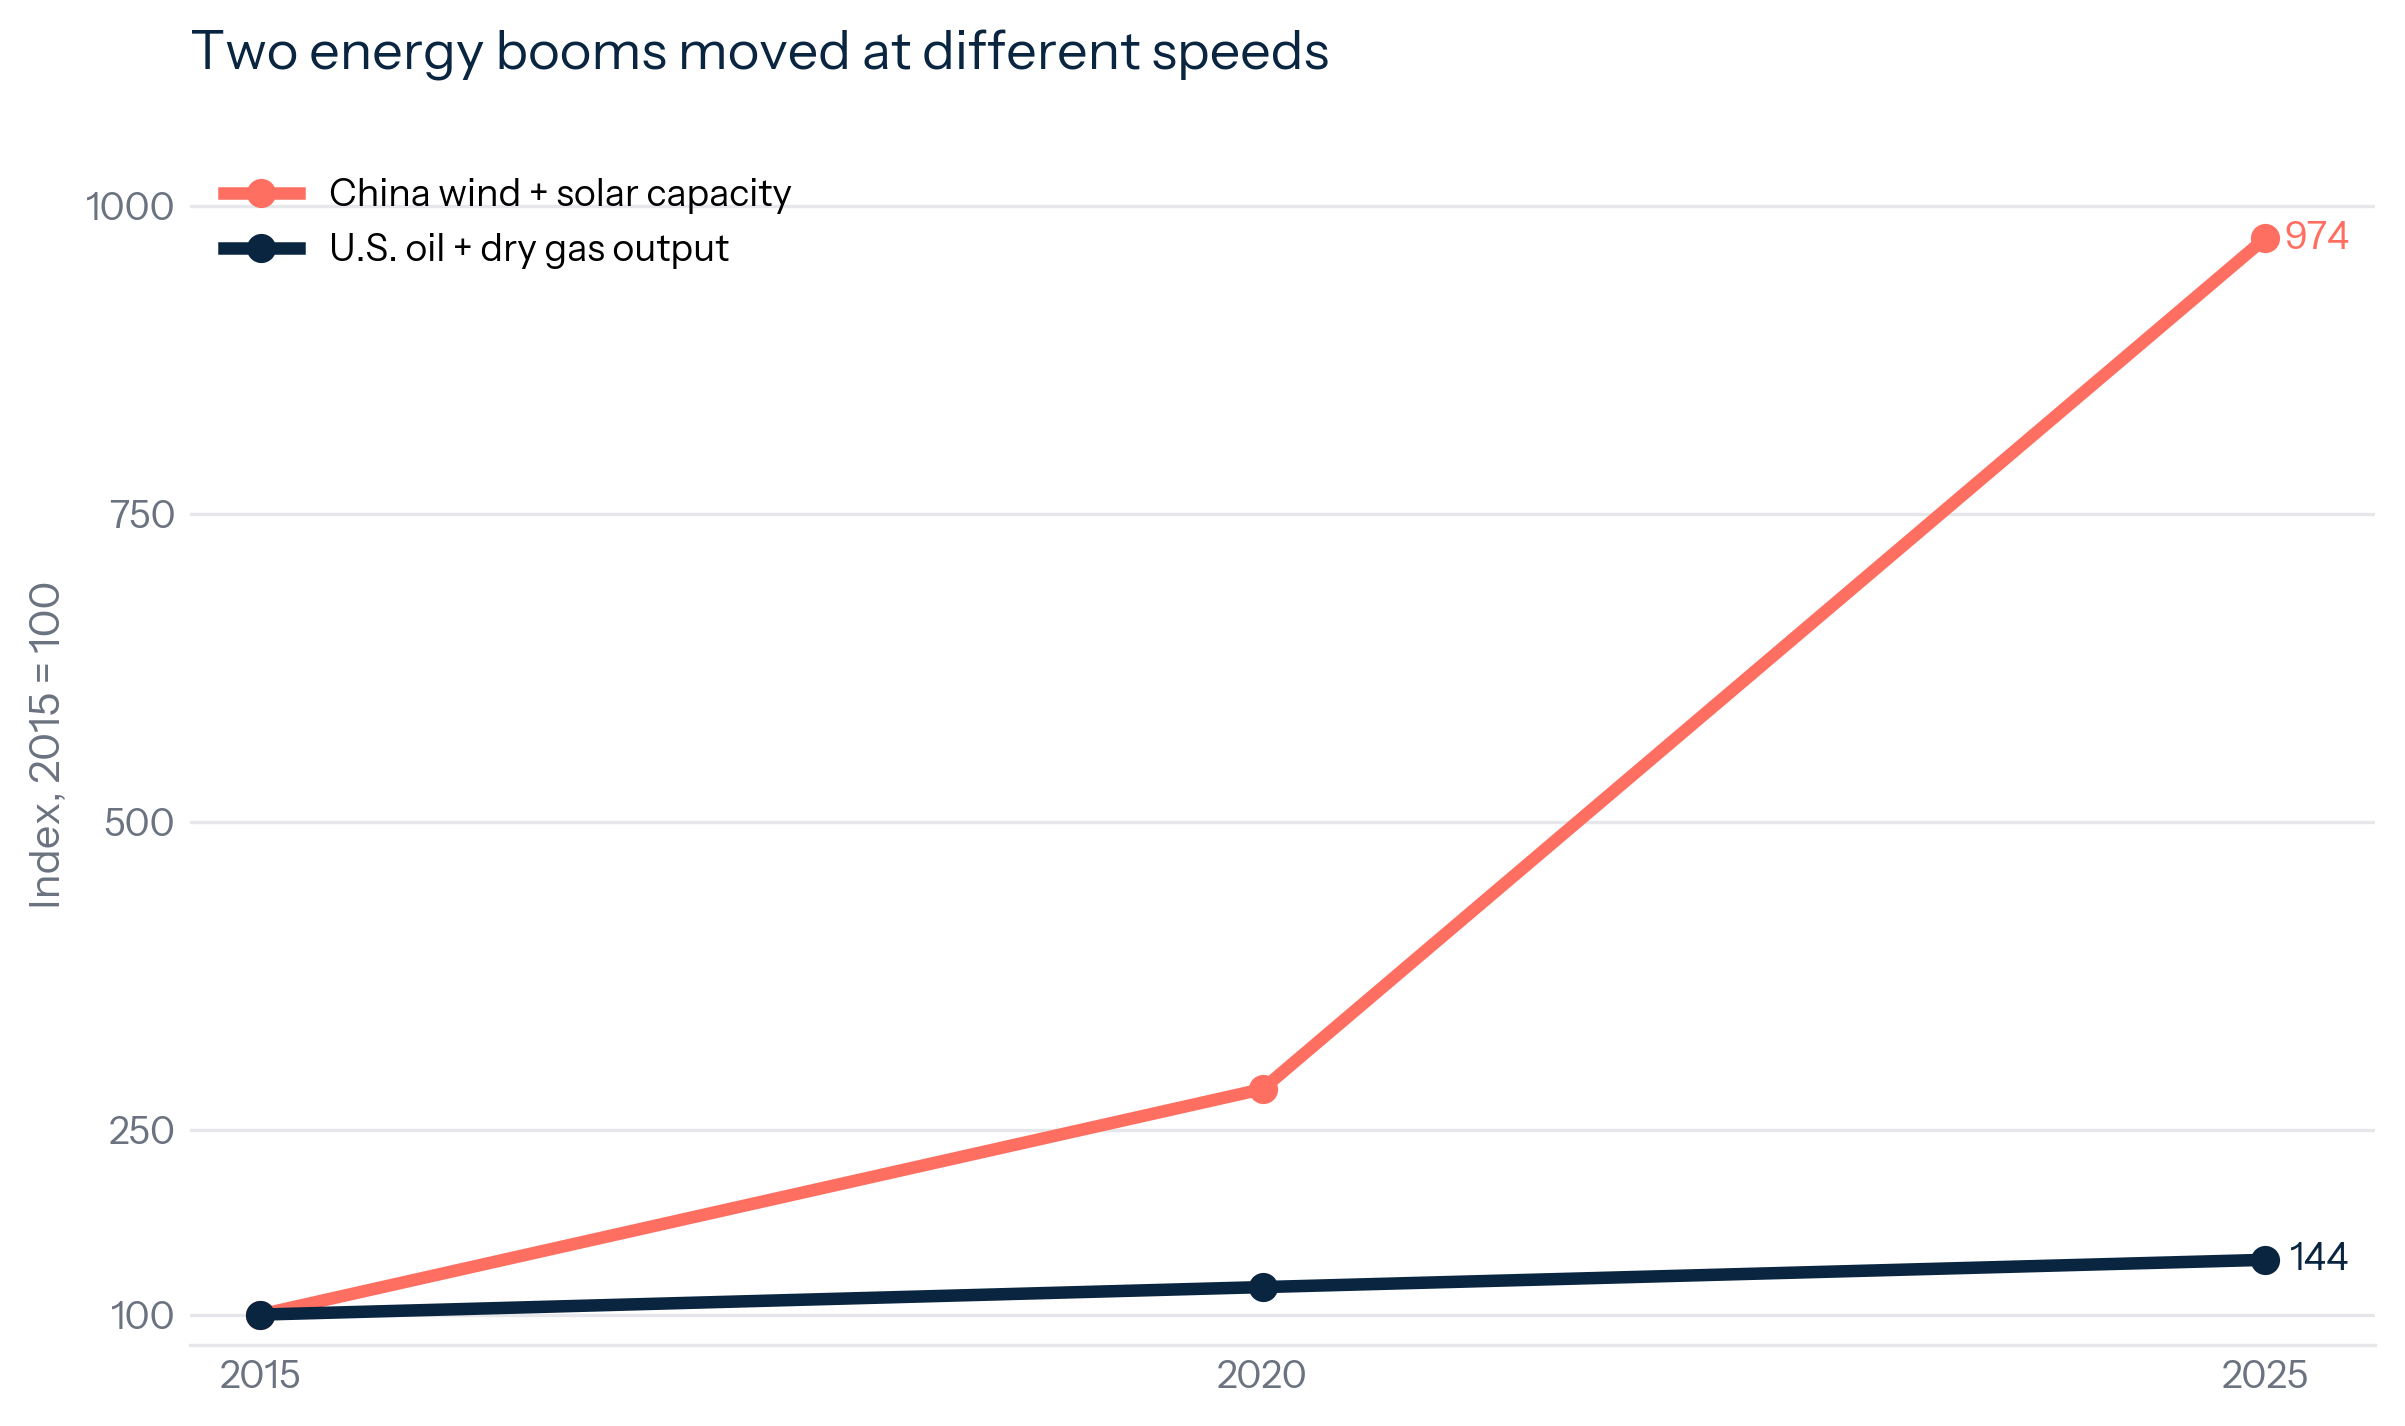
The indexed comparison shows two different forms of compounding. China renewable capacity rises like an industrial deployment curve. U.S. oil and gas production rises like a resource productivity curve. The strategic difference begins after the line rises. For China, capacity must become reliable electricity. For America, production must become stable advantage across domestic prices, exports, and geopolitical shocks.
The two trend lines are production curves first and policy stories second. China renewable line is steep because the country turned the power buildout into an extension of its manufacturing system. Solar modules, wind turbines, batteries, inverters, construction crews, grid companies, and local governments all sat inside one expansion loop. The United States hydrocarbon line is steep because shale made oil and gas a repeatable manufacturing process underground. Drilling targets, pressure pumping, lateral length, sand volumes, water handling, and basin infrastructure turned geology into a modular production system.
That shared industrial logic is the bridge between the two stories. China and America are often described as representing opposite energy futures. The more useful comparison is that both countries found a way to modularize energy production. China modularized clean power hardware above ground. America modularized hydrocarbon extraction below ground. The outcome is two forms of scale that competitors struggle to copy. Europe can buy panels, build offshore wind, and regulate demand while still lacking China's integrated clean-tech supply chain. Importing countries can buy LNG or crude while still lacking U.S. mineral ownership, service depth, pipeline network, and shale learning curve.
The trend lines also show why timing matters. Energy systems usually change slowly because infrastructure has long lives, demand is sticky, and permitting is political. China renewable deployment and U.S. shale growth both compressed the normal pace of change. They did so by making energy production repeatable. Once that happens, the binding constraint shifts away from the initial technology. It moves to absorption, capital discipline, grid expansion, pipelines, storage, dispatch, and market design. The production boom is the opening move in the strategic question.
China Built A Manufactured Energy Model
China renewable buildout is best understood as manufactured energy. The country subsidized wind and solar demand while building the upstream and downstream system around them. Polysilicon, wafers, cells, modules, inverters, battery materials, grid equipment, construction teams, project finance, and provincial targets reinforced one another. The result is a clean-energy complex that deploys power capacity with the tempo of a manufacturing sector.
The numbers show the industrial scale. NEA data reported more than 430 gigawatts of new wind and solar capacity in 2025, up 22 percent from the year before.[1:4] Total wind and solar capacity reached 1.84 billion kilowatts.[1:5] Wind and solar accounted for nearly half of China's total installed power capacity.[1:6] Renewable power generation reached about 4 trillion kilowatt-hours in 2025, a figure China State Council described as larger than the combined power consumption of the European Union.[9] Wind and solar alone supplied 22 percent of national electricity.[1:7] A decade ago, that level of penetration would have looked distant. It is now a live operating problem for the world's largest power system.
The deeper driver is China's industrial strategy. Solar panels, batteries, electric vehicles, power electronics, and grid equipment sit inside the same policy ecosystem. Beijing wants domestic energy security, exportable industrial advantage, lower import exposure, cleaner air, and technological leadership. Renewables serve all five. The buildout reduces dependence on imported fuel at the margin. It creates domestic demand for Chinese manufacturers. It pushes firms down cost curves that then shape global markets. It supports electrification in transport and industry. It gives China a way to frame decarbonization as production power.
That production model has global consequences because China's renewable deployment is tied to its manufacturing dominance. When China overbuilds solar manufacturing, module prices fall. When Chinese battery firms scale, storage costs fall. When Chinese developers build at extreme volume, installation learning moves faster. Other countries benefit from cheaper hardware while also fearing dependence on Chinese supply chains. This is the paradox of manufactured energy. The same system that accelerates global deployment also concentrates industrial power in the country that built the factory.
Exhibit 3: China Built The World Renewable Factory At Home
China is now the deployment engine behind the global clean-power cost curve.
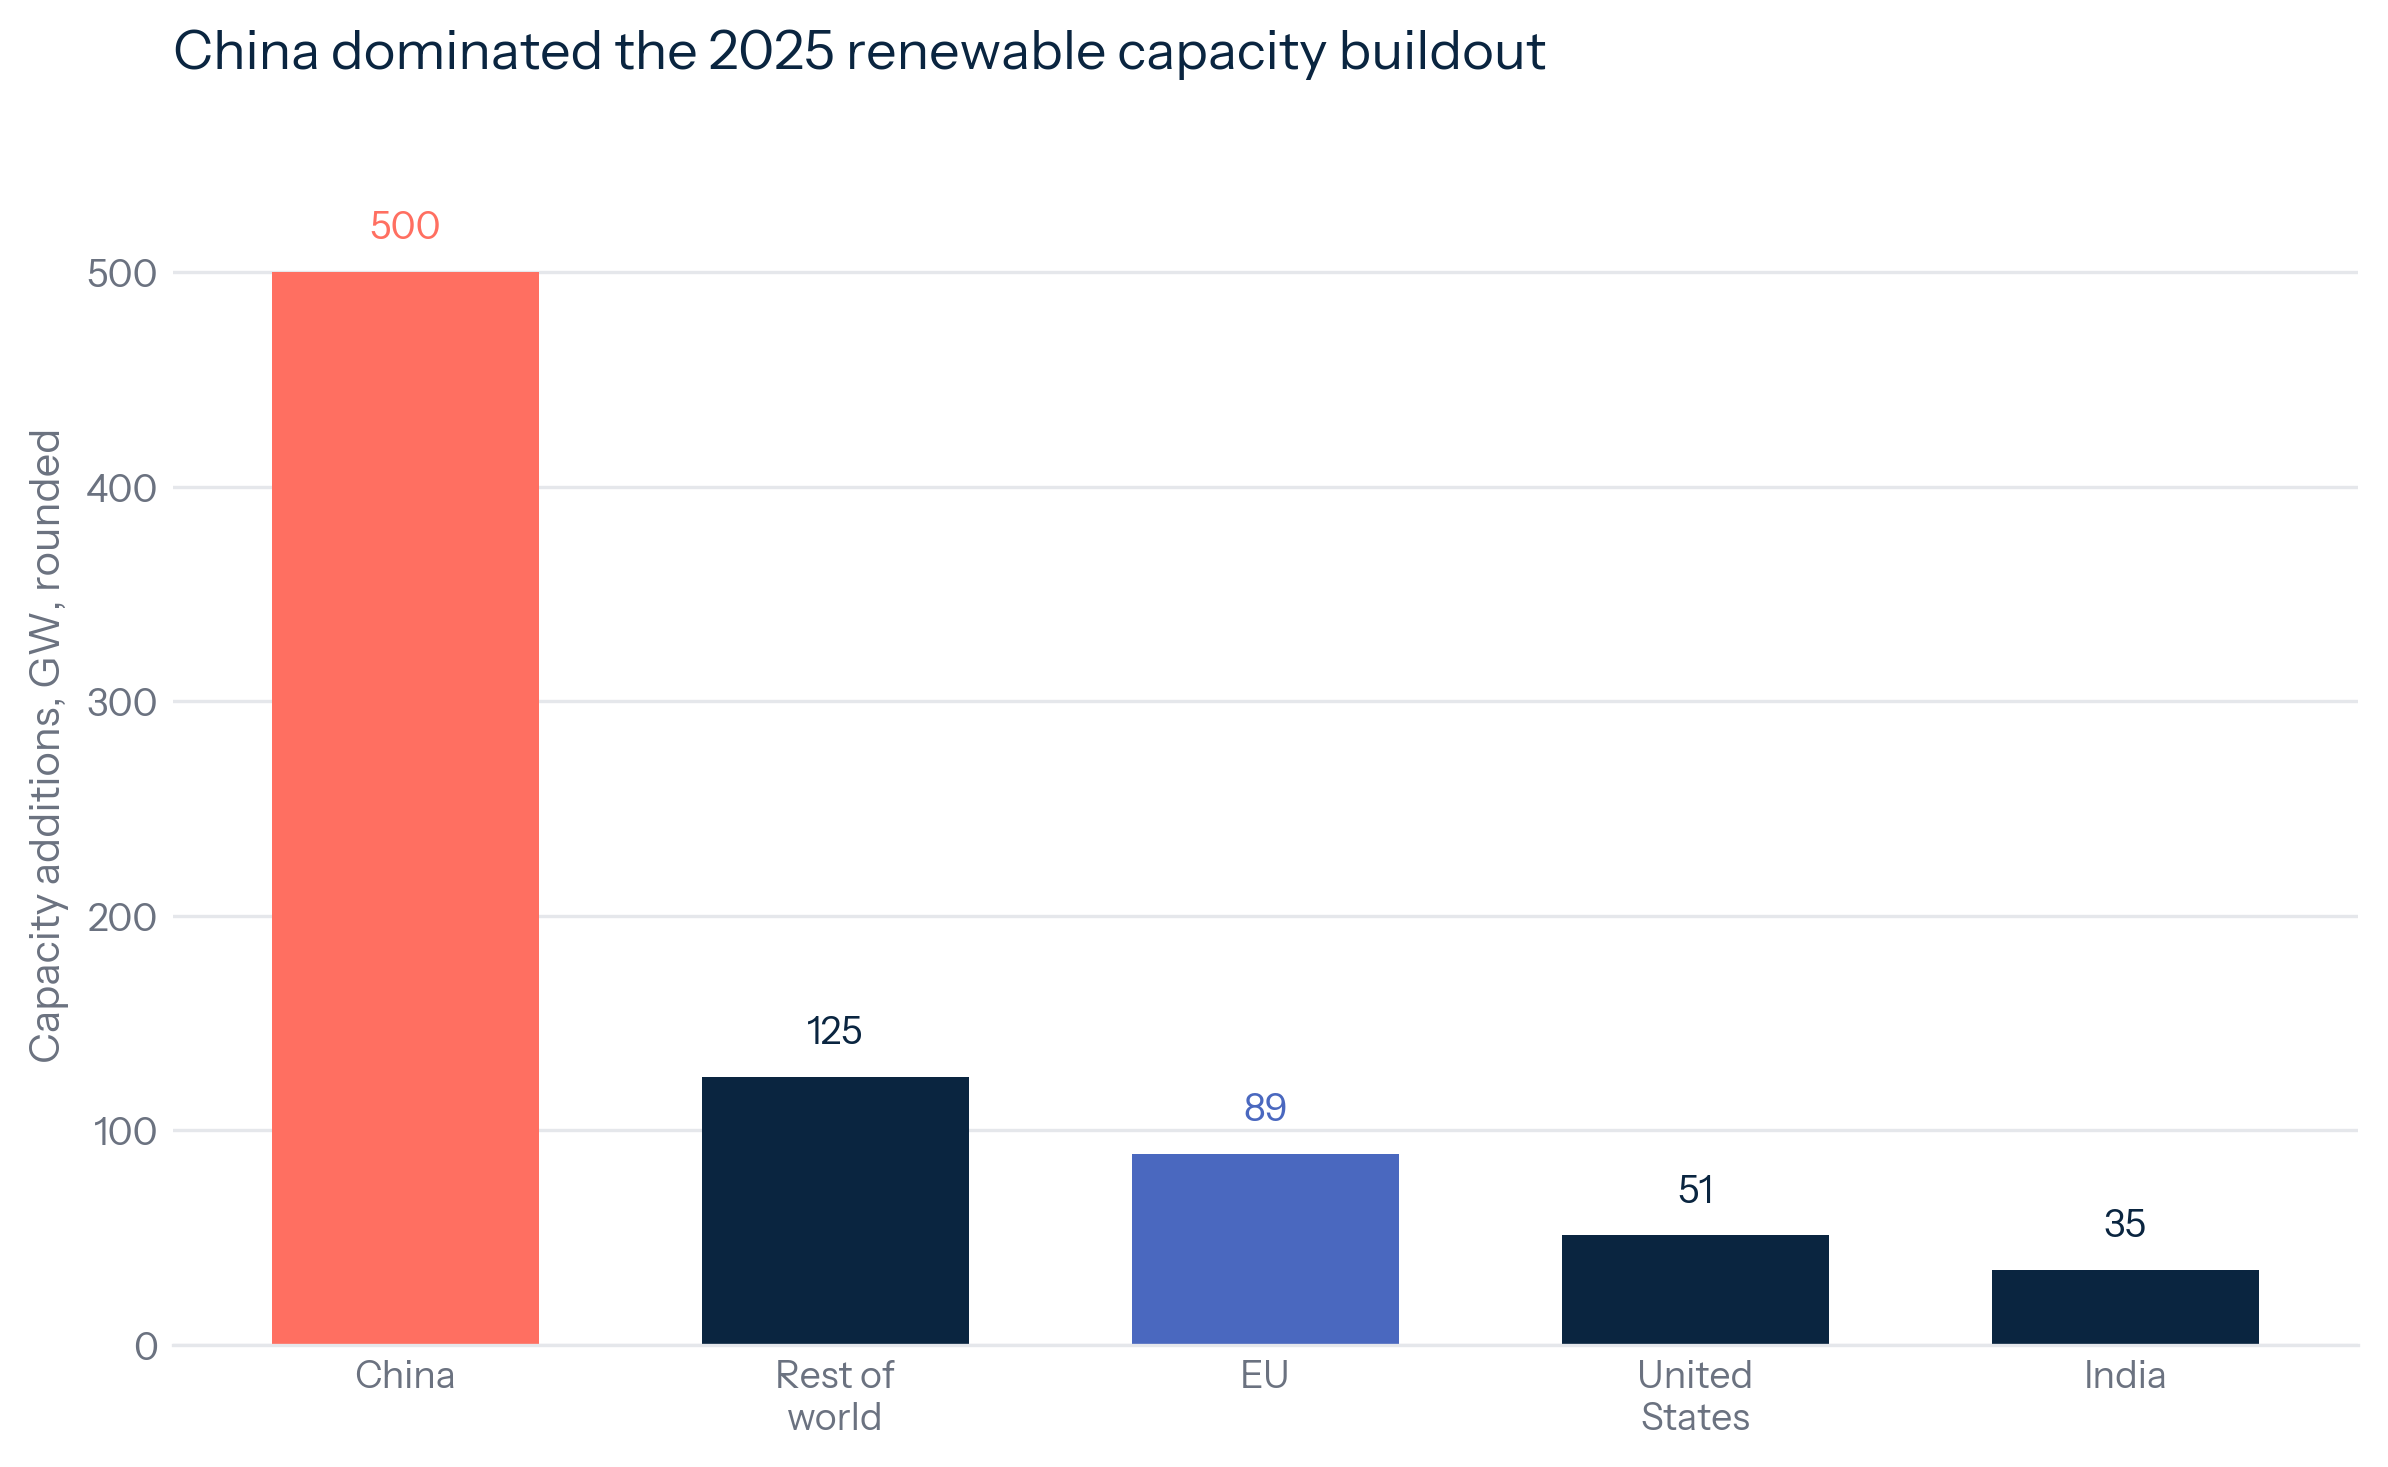
The global comparison is lopsided. China is producing the largest renewable addition pool in the system. IRENA estimated global renewable capacity additions of 692 gigawatts in 2025.[10] IEA, using a broader methodology, estimated about 800 gigawatts.[7:1] Both sources put China at the center of the increase. The exact totals differ by accounting treatment, but the conclusion is stable. China is the deployment engine.
The policy implication is direct. Countries that want renewable electricity without Chinese supply-chain exposure need to pay more, move slower, subsidize domestic capacity, or accept partial dependence. Countries that accept Chinese equipment can deploy faster and cheaper, but they import strategic exposure in modules, batteries, inverters, and grid technology. China's renewable boom reaches beyond China's power mix. It changes the bargaining position of every country trying to electrify.
The deeper implication is that China is exporting a cost curve before it exports a political model. Cheaper modules, batteries, and inverters change what is economic in Brazil, the Gulf, Southeast Asia, Africa, and Europe. They also change what is politically difficult. A government that wants to electrify quickly must explain why it will reject the lowest-cost equipment, spend public money on domestic capacity, or move more slowly in the name of resilience. That is the strategic power of China's manufactured energy. It changes the default option in every clean-power procurement process.
America Built A Geological Energy Model
America's energy boom rests on a different foundation. The United States became the leading oil and gas producer through geology, private capital, technology, mineral ownership, infrastructure, and a competitive service sector. Shale turned dispersed acreage into a production platform. The Permian, Appalachia, Haynesville, Eagle Ford, Bakken, and Gulf systems became the physical base of a new energy position.
The EIA record shows the scale. U.S. total energy production reached 107 quadrillion Btu in 2025.[2:5] Dry natural gas production reached 39 trillion cubic feet.[2:6] Crude oil production reached 13.6 million barrels per day.[3:2] Natural gas plant liquids also set a record.[2:7] Renewables set a record as well, but the defining feature of U.S. energy power remains hydrocarbon scale. America produces more oil than Saudi Arabia or Russia and more natural gas than any other country.[2:8][6:1]
Exhibit 4: America Hydrocarbon Output Is Still Setting Records
The shale system is still expanding, which keeps America at the center of the current fuel economy.
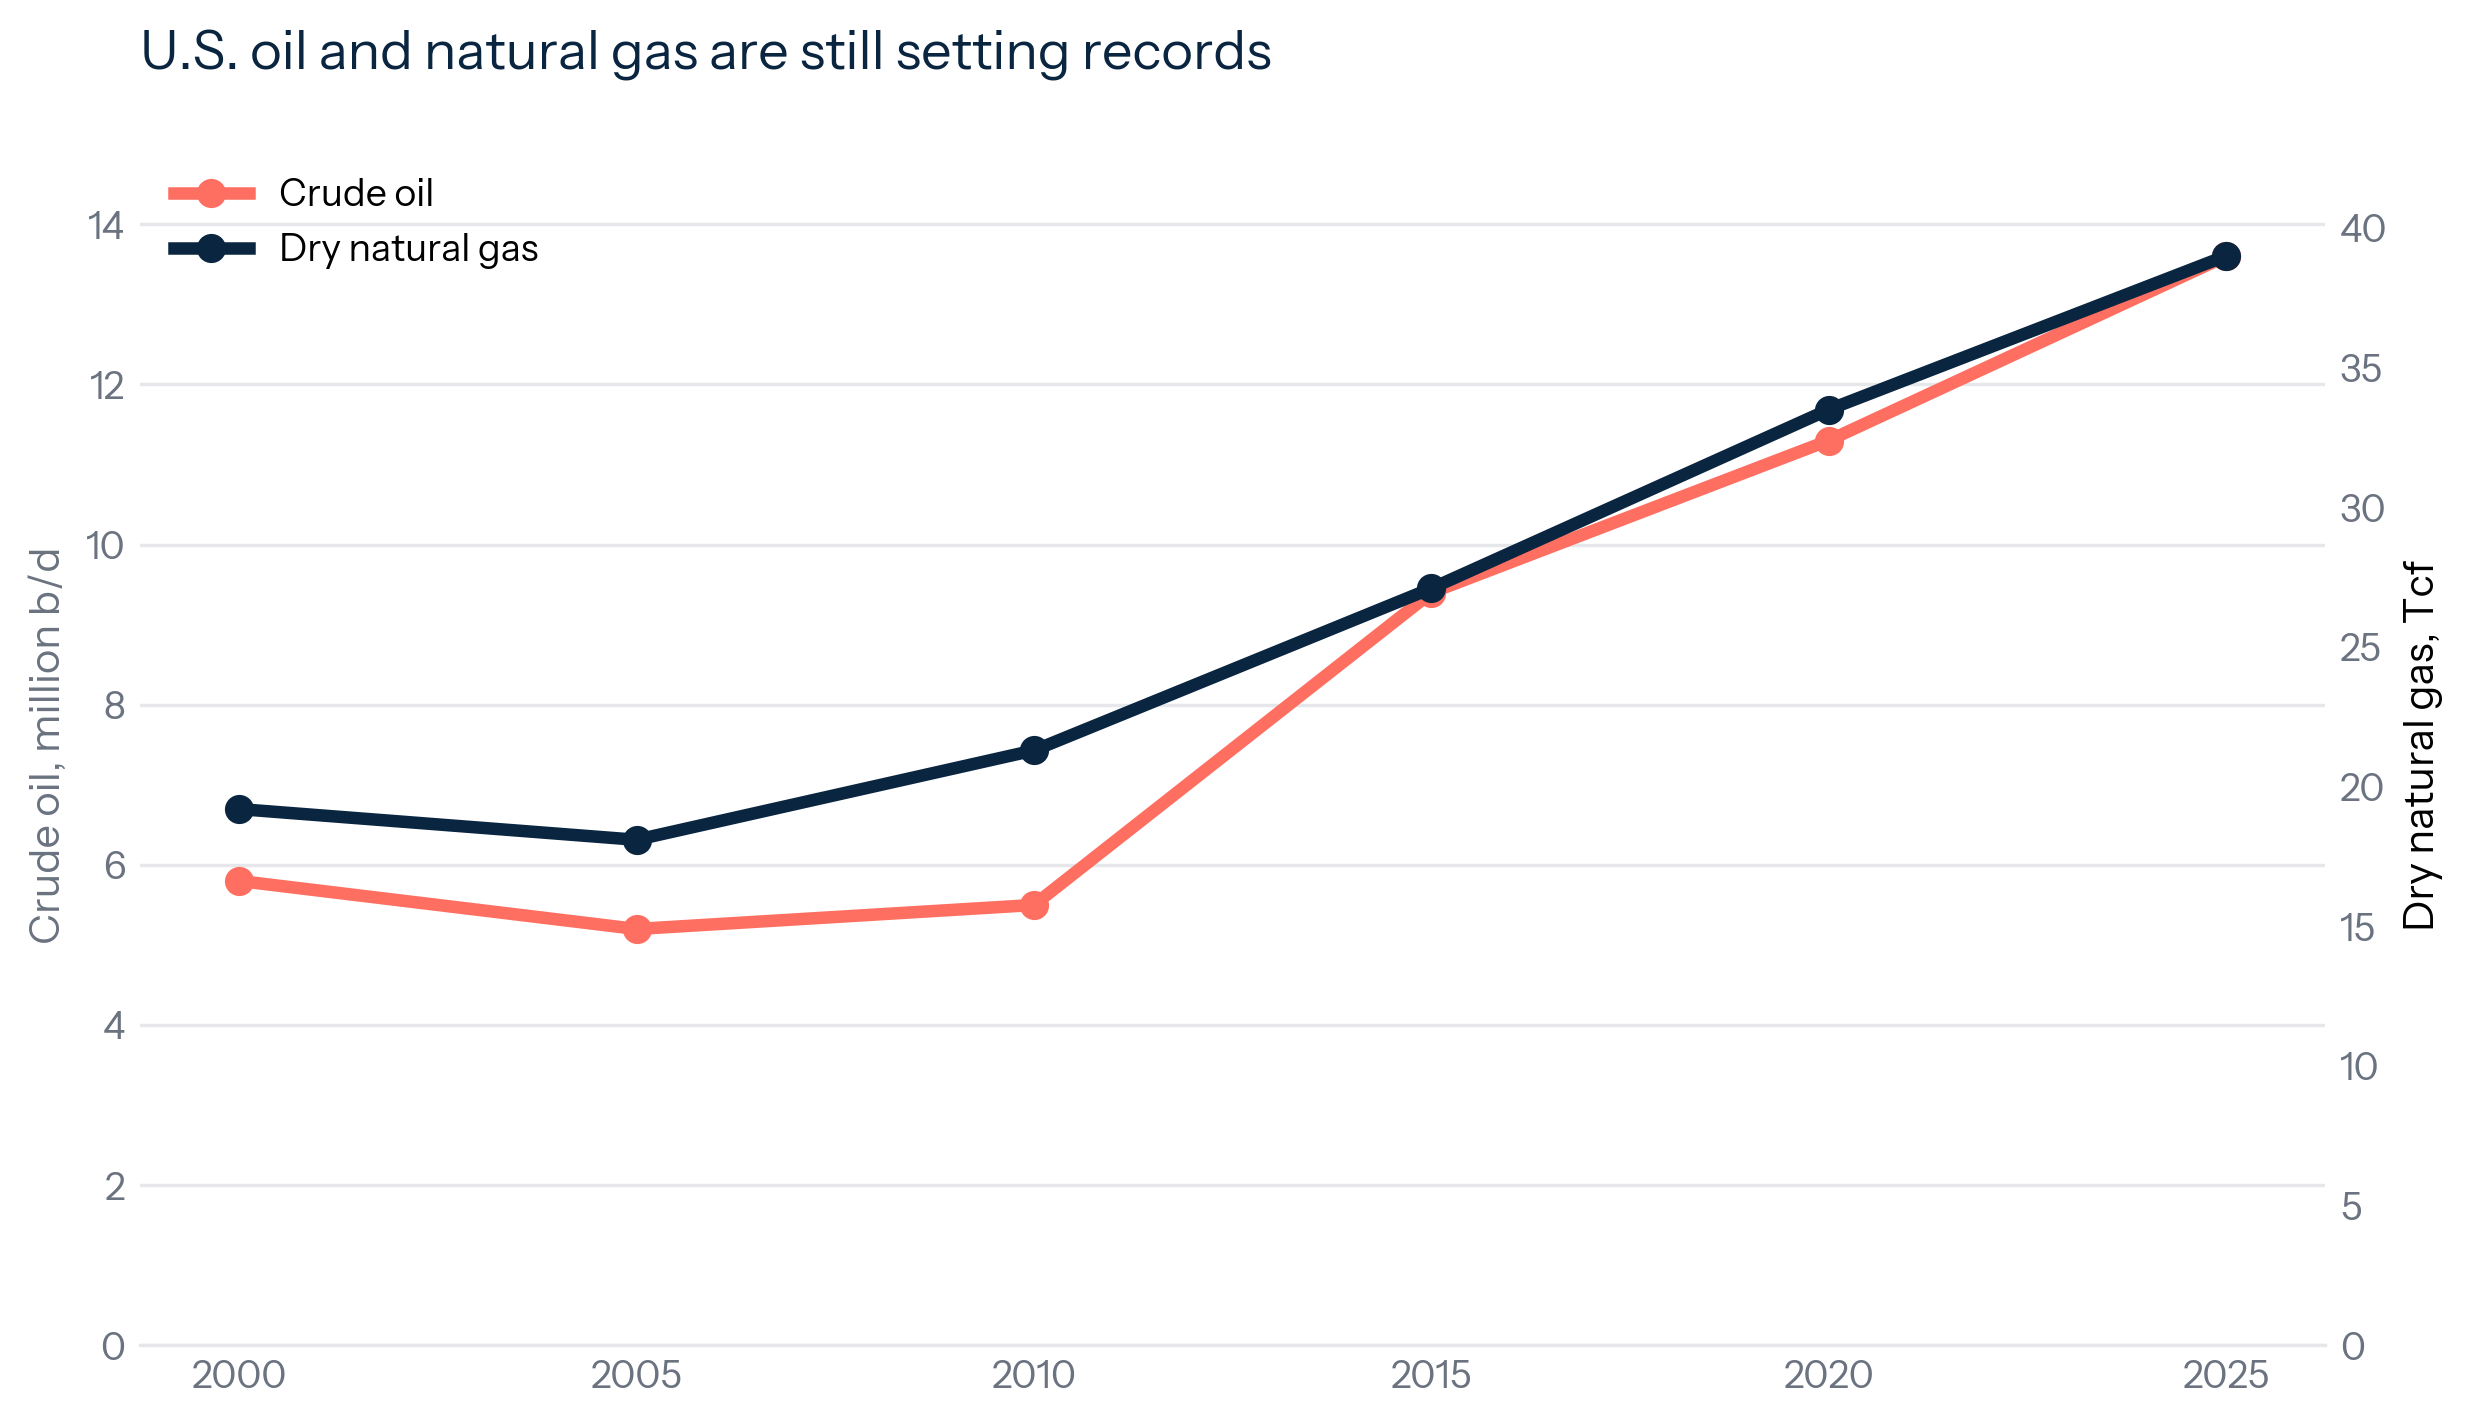
The record line corrects the idea that U.S. oil and gas are a declining legacy system. The United States is still expanding production from a technology and infrastructure base that keeps adapting. That creates domestic resilience. It also creates political tension, because the country is simultaneously building renewables, expanding LNG exports, managing industrial electricity demand, and debating climate policy.
The shale story is now mature enough to be measured by basin structure. EIA revised its estimates for Permian tight oil and shale gas in 2026, putting Permian formations at 6.0 million barrels per day of crude oil and 22.2 billion cubic feet per day of dry natural gas in December 2025.[11] EIA separately reported that the Permian region accounted for 23 percent of U.S. marketed natural gas production in 2025 and about half the annual growth.[8:1] One basin now operates like a major producing country inside the United States.
That changed the strategic psychology of the United States. For much of the twentieth century, U.S. energy policy was shaped by scarcity, import dependence, Middle East exposure, and price shocks. The shale era reversed the baseline. The United States became a net exporter of total energy on an annual basis in 2019.[5:1] LNG cargoes became diplomatic instruments. Crude exports changed Atlantic Basin flows. Low-cost gas supported petrochemicals, power generation, industrial heat, fertilizer, and data-center siting. A country once defined by oil vulnerability became a country with hydrocarbon optionality.
The LNG buildout turns that optionality into foreign policy. EIA expects U.S. LNG exports to keep rising as new projects enter service, with annual exports forecast to exceed the 2025 record through 2026 and 2027.[12] EIA also reported that U.S. LNG exports to Europe reached a record 10.3 billion cubic feet per day in 2025, accounting for 68 percent of U.S. LNG export volumes.[12:1] That is the geopolitical version of the shale boom. U.S. gas moves through private contracts and commercial terminals, but it also backs allied energy security when Europe is trying to reduce Russian exposure.
The bottleneck is the field decline treadmill. Shale production requires continuous reinvestment. Wells decline fast. Capital discipline can slow drilling. Service costs can rise. Pipeline constraints can discount gas. LNG exports can tighten domestic markets. Methane rules, water limits, permitting fights, and price cycles can all change the production path. America's geological model is powerful because it is flexible. Its fragility is that flexibility depends on continuous private investment under volatile prices.
The World Scale Is Uneven
Energy power is easier to understand when countries are placed on the same map. China dominates renewable capacity additions. The United States dominates oil and gas production. Russia remains a major hydrocarbon power while facing sanctions, technology limits, and market rerouting. Saudi Arabia retains low-cost oil power and spare-capacity influence. India is the large demand growth story, with renewable growth rising from a much smaller base than China. Europe is a clean-energy policy leader with limited domestic hydrocarbon scale and persistent import exposure.
The result is a split hierarchy. China is strongest where energy is manufactured. The United States is strongest where energy is extracted and exported. Russia and Saudi Arabia remain strongest where conventional hydrocarbons and state control matter. Europe is strongest in regulation, demand efficiency, offshore wind experience, and climate finance. India is strongest as future demand. The global energy transition creates several ladders at once.
Exhibit 5: Country Scale, Different Resources
The global energy map is split between clean-power scale and hydrocarbon scale, with most countries forced to buy from one side or the other.
Energy leadership has become domain-specific. A country can have power over the future cost curve while another has power over the current fuel system. China can move the global price of solar modules. America can move LNG availability and oil-market psychology. Saudi Arabia can still shape crude balances. Russia can still affect gas and oil flows, even under constraint. India can reshape demand growth. No single metric captures the system.
This matters because countries can lead in one energy domain while remaining exposed in another. China leads in renewable capacity and clean-tech manufacturing, yet still burns large amounts of coal and imports oil and gas. The United States leads in oil and gas production, yet still faces grid congestion, power-demand growth, and a contested clean-tech manufacturing position. Europe leads in policy ambition, yet pays the price of import dependence and slower industrial pass-through. India grows quickly, yet must balance coal reliability with renewable expansion and import exposure.
The country ranking also changes the sense of proportion. China's renewable additions are so large that conventional country comparisons can feel inadequate. The right comparison is often China against regions or the rest of the world. The United States hydrocarbon position has the same property. A single U.S. basin can carry production weight that resembles a national system. The two booms are outliers with their own internal geography.
The internal geography matters. China's renewable system is spread across western and northern resource provinces, coastal industrial demand centers, and national transmission corridors. The U.S. hydrocarbon system is concentrated in the Permian, Appalachia, Haynesville, the Gulf Coast, and connected export infrastructure. In both cases, national power depends on subnational bottlenecks. A power line delay in China can strand renewable generation. A pipeline delay in the United States can strand gas. A provincial dispatch rule can keep coal running. A local permitting fight can slow an LNG-linked project. The headline country ranking conceals the operational map underneath it.
The comparison with Europe and India gives the argument political relevance. Europe is trying to reduce hydrocarbon exposure while rebuilding industrial competitiveness under high energy costs and security pressure. India is trying to expand electricity supply, manage coal dependence, and build renewables without sacrificing growth. Japan, Korea, and many emerging importers face the same structural problem in different forms: they can buy supply, finance projects, and subsidize industry, but they do not command a production machine on the scale of China renewables or U.S. oil and gas. That is the strategic gap. The countries in the middle are buyers, adapters, and hedgers.
The clean-versus-fossil frame hides the operating hierarchy. Oil, gas, solar, wind, batteries, grids, and transmission do different jobs. They operate on different time scales. They depend on different infrastructures. They create different vulnerabilities. The transition is a reallocation of power across technologies, geographies, supply chains, and balance sheets. Countries without a production engine can still build strong energy systems, but they bargain from a different position. They buy equipment, fuel, technology, insurance, and time from the countries that produce at scale.
For investors and policymakers, the implication is uncomfortable. The winner is the country that can turn its energy system into durable economic and strategic advantage. China renewable scale is real. America hydrocarbon scale is real. The binding constraint will decide how much power each boom produces.
Capacity Differs From Output
China's renewable boom needs one especially careful distinction. Capacity differs from output. A gigawatt of solar capacity does not produce the same amount of energy as a gigawatt of coal or nuclear capacity. It produces when the sun is available. A wind turbine produces when the wind is available. A power system must balance generation and demand in real time. That makes utilization, storage, transmission, dispatch, and curtailment central to the strategic value of the buildout.
Exhibit 6: Capacity Is Ahead Of Generation
China has already built the capacity base for a clean-power shift; the unresolved question is how quickly it becomes delivered electricity.
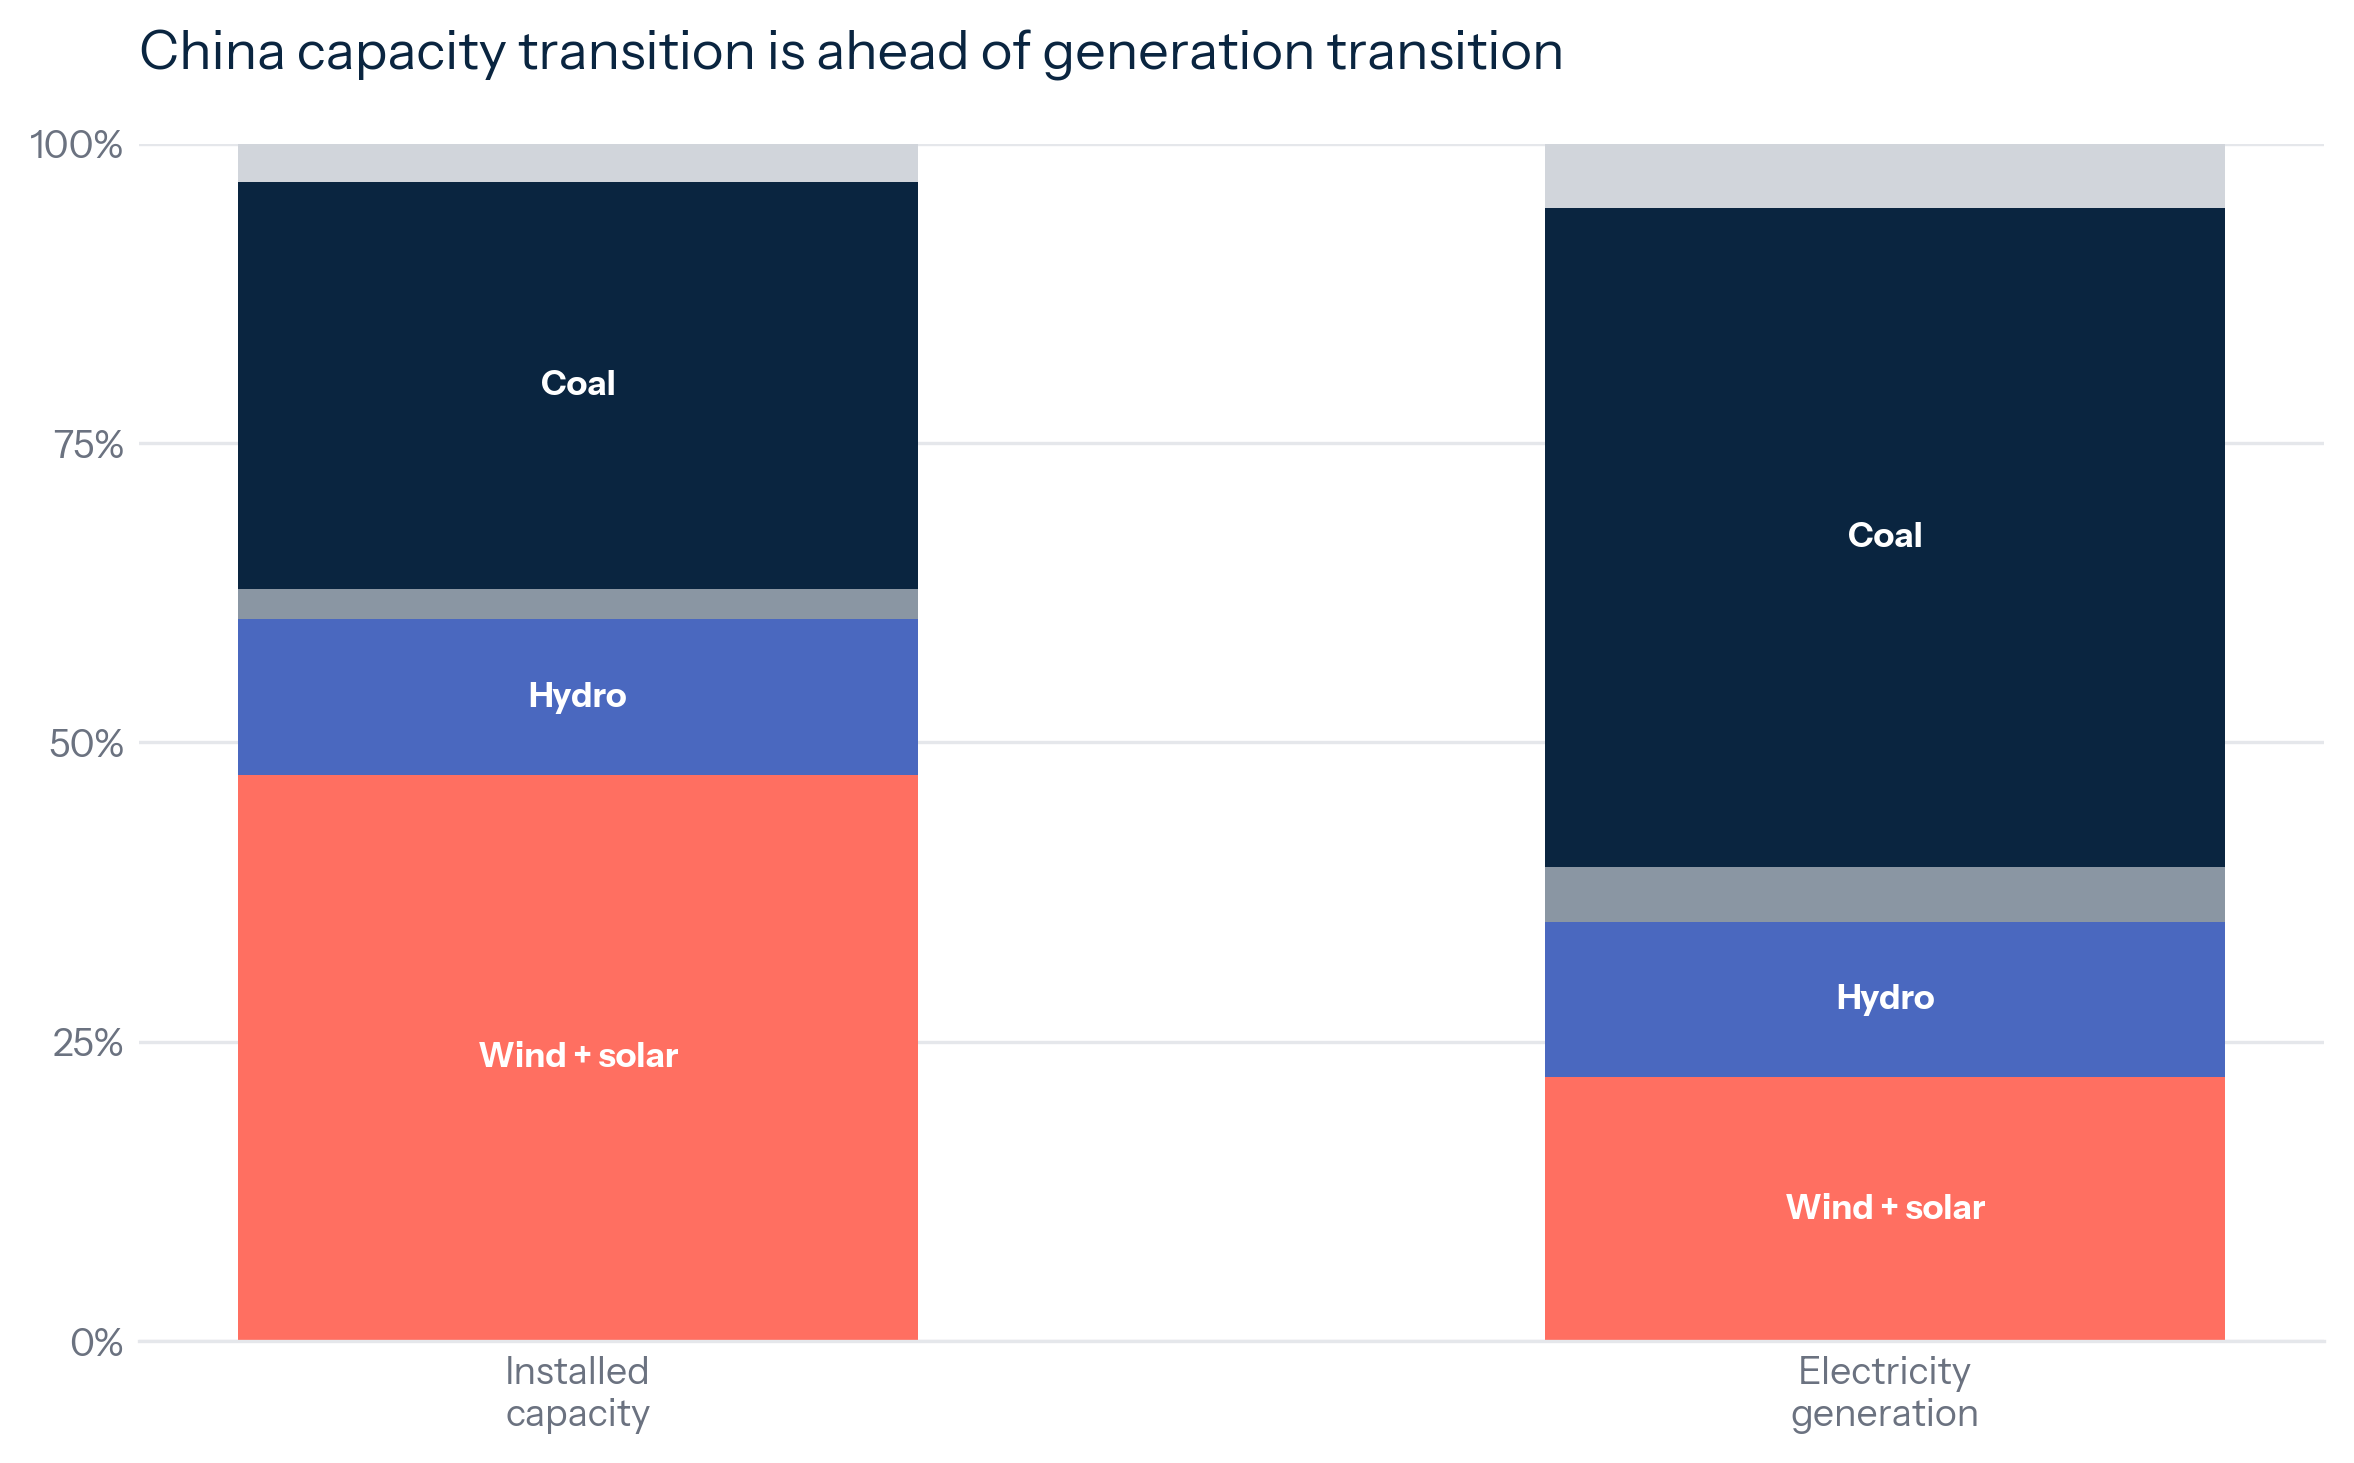
This distinction prevents a common error. China's renewable numbers are often cited as if capacity and generation were interchangeable. They are separate measures. The strategic claim becomes stronger once the distinction is explicit. China has already built enough renewable capacity to change the system. The next power dividend depends on raising delivered clean electricity, reducing curtailment, expanding storage, improving interprovincial transmission, and changing dispatch incentives.
China installed capacity data show the scale of the buildout. Generation data show the scale of system pass-through. Wind and solar reached 47.3 percent of installed capacity in 2025, but supplied 22 percent of electricity.[1:8] That gap is expected because solar and wind have lower capacity factors than thermal generation. It also identifies the next test. China must raise the usable share of renewable electricity without undermining reliability in industrial provinces, winter peaks, evening demand, or regional stress events.
Coal remains central because it provides dispatchable power and political insurance. IEA reported that strong renewable and nuclear growth, together with slower electricity demand growth than in 2024, helped push China coal-fired output down in 2025.[4:1] IEA also estimated that coal-fired generation fell to 55 percent of China's electricity in 2025 from 70 percent a decade earlier.[4:2] That is a major shift, but it still leaves coal as the anchor fuel in the world's largest power system.
The same distinction applies to the United States in a different form. U.S. oil and gas production is output, but output differs from strategic value. A barrel sold into a weak market delivers less leverage than a barrel sold into scarcity. Gas without pipeline capacity can be discounted. LNG exports can increase geopolitical influence while also tying domestic gas prices more closely to global demand. Energy abundance must pass through infrastructure and markets before it becomes power.
That shared lesson brings the two systems back together. China must turn capacity into usable electricity. America must turn output into durable advantage. Both countries face a middle layer between physical supply and strategic power. The middle layer is where the next decade will be decided.
Abundance Has Different Bottlenecks
Energy abundance creates its own constraints. China's renewable model is constrained by absorption. America's hydrocarbon model is constrained by reinvestment and infrastructure. These constraints perform the same function. They determine how much of the headline boom becomes usable power.
China's absorption problem has several layers. Transmission must move renewable electricity from resource-rich interior and northern provinces to demand-heavy coastal and industrial regions. Storage must smooth solar output and wind variability. Power markets must reward flexibility. Coal plants must shift from baseload generation toward balancing and reserve services. Industrial demand must become more flexible. Provincial governments must accept power flows that may weaken local generators. Each layer is technical. Each layer is also political.
The most important Chinese energy question is how quickly the power system can absorb the buildout. China can keep adding panels and turbines. Absorption is the harder test. If China solves that problem, it gains lower marginal power costs, greater electrification potential, less import exposure, and stronger clean-tech dominance. If it struggles, it will have a large renewable fleet, persistent coal dependence, and rising pressure to build storage, grids, and market reform faster.
The U.S. bottleneck is the production treadmill. Shale output depends on a continuous sequence of acreage selection, drilling, completions, processing, water handling, pipeline access, and capital availability. Fields decline. Inventories of premium drilling locations change. Associated gas can overwhelm takeaway capacity. LNG terminals need pipelines, contracts, financing, and permits. The system can grow quickly when incentives align, then tighten quickly when prices, regulation, or infrastructure move against it.
Exhibit 7: From Production Boom To Strategic Power
The next advantage sits in grids, storage, LNG capacity, pipelines, dispatch rules, and market design.
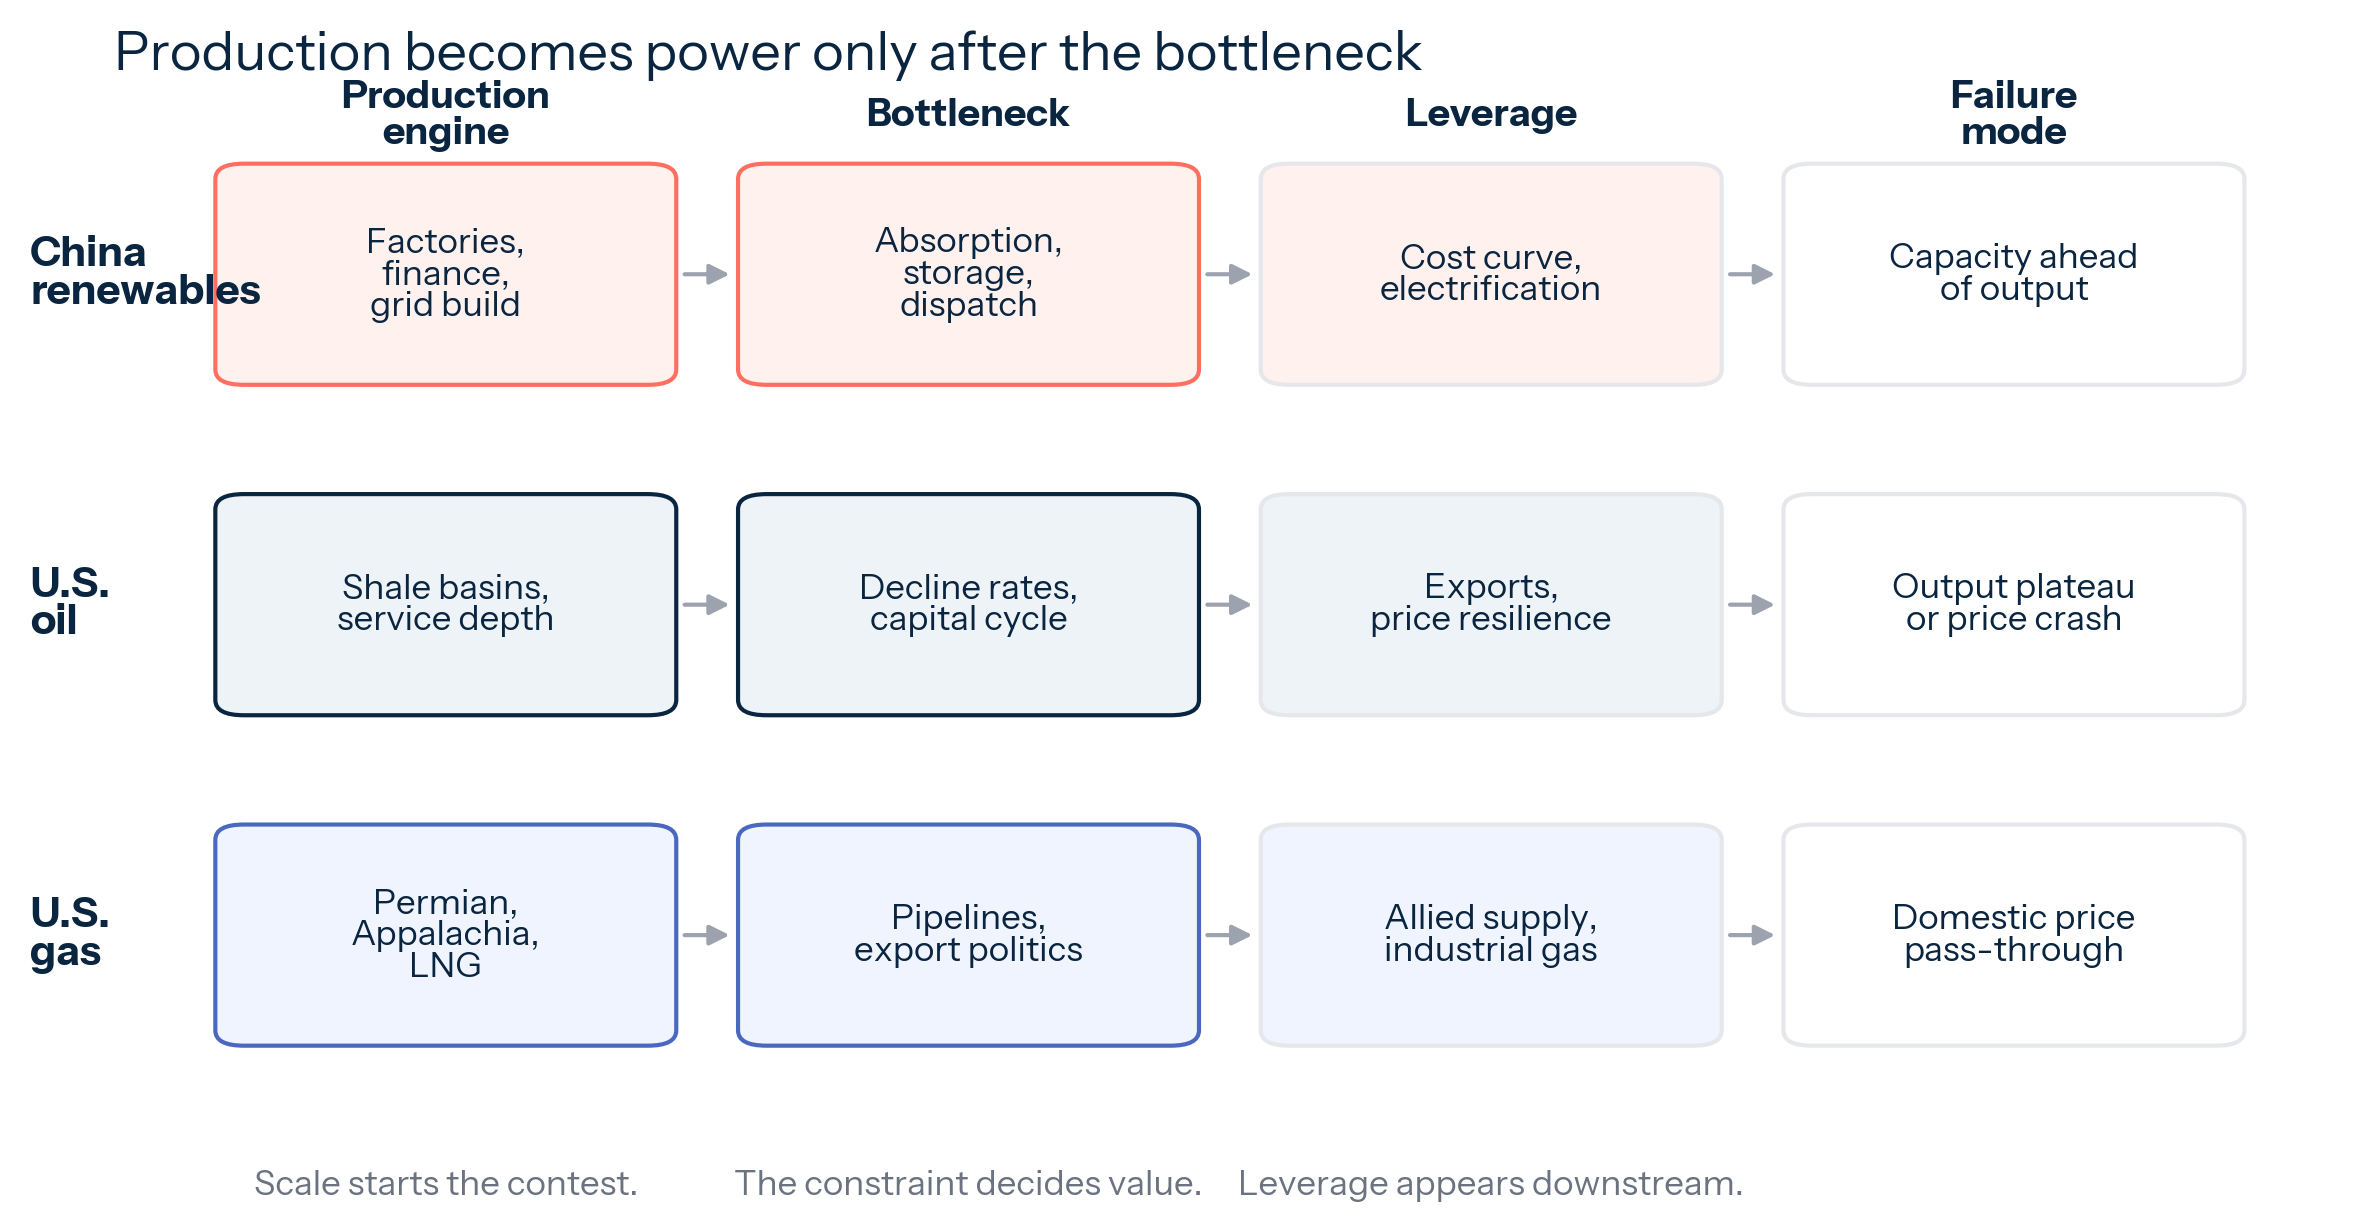
The flow map turns abundance into a practical test. China's failure mode is overcapacity without absorption. U.S. oil's failure mode is price-cycle dependence and field decline. U.S. gas's failure mode is infrastructure congestion, export tension, and domestic price pass-through. The winner in each domain will be the system that manages the bottleneck while competitors remain stuck in debate, permitting, or import dependence.
The American political bottleneck is also rising. The United States wants low gasoline prices, low natural gas prices, high LNG exports, strong oil and gas employment, lower emissions, power reliability, data-center electricity, and climate progress. Those objectives can coexist in some periods. They can also collide. More LNG exports support allies and producers while raising concern about domestic gas price exposure. More drilling supports supply while facing environmental and local opposition. More gas power supports grid reliability while complicating climate targets.
That makes the U.S. model more cyclical than the Chinese model. American production responds to prices, capital markets, service costs, and shareholder discipline. China renewable deployment responds more directly to planning targets, manufacturing capacity, provincial incentives, and grid investment. The American system can adjust faster when markets reward output. The Chinese system can keep building through weak project economics if the industrial objective remains strong. One model is more adaptive. The other is more directive. The strategic question is which kind of coordination is more valuable when the bottleneck shifts from production to integration.
The broader point is that energy transition analysis often overweights the fuel and underweights the system. The country that adds the most solar panels still needs grids. The country that drills the most oil wells still needs stable capital and pipeline access. The country that exports LNG still needs domestic political consent. The country that imports cheap panels still needs industrial strategy if it wants domestic manufacturing. Energy power lives in the whole chain.
Implications
First, energy power is shifting from resource possession to system yield. Owning coal, oil, gas, sun, or wind matters less if a country cannot move energy through the machinery that makes it valuable. China's renewable buildout reinforces its manufacturing position, but the power dividend depends on transmission, storage, dispatch, and market reform. America's hydrocarbon abundance changes its inflation, trade, and foreign-policy position, but shale power depends on reinvestment, basin productivity, pipeline access, export capacity, and political consent. The decisive asset is the system that turns raw supply into delivered advantage.
Second, importers face a cost-security-autonomy trilemma. Countries can buy cheap Chinese clean-tech equipment and move faster. They can subsidize local manufacturing and pay more. They can import U.S. LNG and gain supply flexibility while accepting exposure to global gas markets. The practical strategy will be mixed, but the direction is clear. Importers want abundance without dependence. That is the hardest combination to buy. Europe's problem is the most visible version of the trade-off. It wants clean power, industrial resilience, cheaper energy, and lower Russian exposure at the same time. No supplier gives it all four.
Third, the next strategic advantage sits in the infrastructure layer. In China-linked clean energy, the important variables are curtailment, grid investment, storage costs, inverter supply, power-market reform, and export restrictions. In U.S. oil and gas, the important variables are shale productivity, decline rates, pipeline capacity, LNG terminal timing, Henry Hub sensitivity, and capital discipline. Price signals usually appear first at the constraint: negative power prices, curtailment, basis blowouts, flaring pressure, LNG tolling margins, and regional electricity congestion.
Climate and security have to be measured together. Wind and solar reduce emissions when they displace fossil generation. Oil and gas continue to carry climate costs. The strategic fact remains that both systems generate power in the world as it exists. China's renewable machine shapes the cost and pace of decarbonization. America's hydrocarbon machine shapes the security and price of the existing fuel system. A serious energy strategy has to measure displacement, reliability, emissions, cost, supply-chain exposure, and geopolitical leverage together.
What To Watch
The first test is China utilization. Wind and solar output need to rise faster than capacity while curtailment stays contained. Coal generation is the companion measure. China can add huge volumes of renewables while coal remains the balancing fuel. The deeper turn comes when renewable and nuclear growth reduce coal output through normal demand conditions across weak and strong industrial periods. Battery additions, pumped hydro, ultra-high-voltage lines, and interprovincial market reform will show whether the hardware boom is becoming a national power asset.
The second test is U.S. hydrocarbon durability. Record oil and gas output depends on shale productivity, acreage quality, decline rates, pipeline access, and capital discipline. The Permian can keep extending the boom if longer laterals, better completions, processing capacity, and export infrastructure offset depletion. If productivity slows while capital discipline tightens, the record plateau becomes harder to defend.
The third test is pass-through. More U.S. LNG capacity increases geopolitical leverage, but it links domestic gas markets more tightly to global demand. Allies want U.S. gas. Producers want export markets. Domestic consumers want low prices. China faces its own pass-through test in electricity: cheap renewable hardware has to become cheap, reliable power for industry, transport, heat, and data centers. Production creates the option. Demand determines the value of the option.
The bottom line is that China and the United States are building different machines for energy abundance. China has the manufactured-energy machine. America has the geological-energy machine. The next decade will turn on strategic yield: China must turn capacity into reliable clean electricity, and America must turn hydrocarbons into durable leverage without losing the advantage to decline rates, price cycles, and infrastructure politics. The country that solves its last-mile problem first will own the stronger form of energy power.
Notes
- China State Council, "China's wind, solar power capacity climbs in 2025," February 12, 2026, citing National Energy Administration data. https://english.www.gov.cn/archive/statistics/202602/12/content_WS698d93cbc6d00ca5f9a091bb.html ↩︎ ↩︎ ↩︎ ↩︎ ↩︎ ↩︎ ↩︎ ↩︎ ↩︎
- U.S. Energy Information Administration, "U.S. energy production set a record in 2025," Today in Energy, May 11, 2026. https://www.eia.gov/todayinenergy/detail.php?id=67684 ↩︎ ↩︎ ↩︎ ↩︎ ↩︎ ↩︎ ↩︎ ↩︎ ↩︎
- U.S. Energy Information Administration, "U.S. crude oil production set a record in 2025," Today in Energy, March 31, 2026. https://www.eia.gov/todayinenergy/detail.php?id=67404 ↩︎ ↩︎ ↩︎
- International Energy Agency, Global Energy Review 2026, "Electricity supply," 2026. https://www.iea.org/reports/global-energy-review-2026/electricity-supply ↩︎ ↩︎ ↩︎
- U.S. Energy Information Administration, "U.S. energy facts explained: imports and exports," accessed June 5, 2026. https://www.eia.gov/energyexplained/us-energy-facts/imports-and-exports.php ↩︎ ↩︎
- U.S. Energy Information Administration, "United States produces more natural gas than any other country," Today in Energy, 2026. https://www.eia.gov/todayinenergy/detail.php?id=66584 ↩︎ ↩︎
- International Energy Agency, Global Energy Review 2026, "Solar PV and wind," 2026. https://www.iea.org/reports/global-energy-review-2026/technology-solar-pv-and-wind ↩︎ ↩︎
- U.S. Energy Information Administration, "U.S. natural gas production reached a new record in 2025," Today in Energy, April 2026. https://www.eia.gov/todayinenergy/detail.php?id=67345 ↩︎ ↩︎
- China State Council, "China's renewable energy generation tops 4 trillion kWh in 2025," January 30, 2026, citing National Energy Administration data. https://english.www.gov.cn/archive/statistics/202601/30/content_WS697cb463c6d00ca5f9a08da7.html ↩︎
- International Renewable Energy Agency, "Near 700 GW surge in 2025 proves renewable energy resilience," April 2026. https://www.irena.org/News/pressreleases/2026/Apr/Near-700-GW-Surge-in-2025-Proves-Renewable-Energy-Resilience ↩︎
- U.S. Energy Information Administration, "EIA refines estimates for Permian tight oil and shale gas production," Today in Energy, April 2026. https://www.eia.gov/todayinenergy/detail.php?id=67364 ↩︎
- U.S. Energy Information Administration, "U.S. natural gas exports to grow nearly 30% by 2027 as LNG facilities ramp up," Today in Energy, May 2026. https://www.eia.gov/TODAYINENERGY/detail.php?id=67484 ↩︎ ↩︎