Climate risk is being priced every year through the insurance market. The losses are large. The more important shift is institutional: insurers are raising rates, narrowing coverage, and leaving markets they can no longer price with confidence. Public backstops are taking on the exposure private capital rejects. Households are seeing insurance consume a larger share of the monthly housing bill. Lenders are learning that a property's value depends on location, income, rates, and insurability. The decisive map is now the coverage map.
Global natural disasters caused roughly $224 billion in losses in 2025, of which insurers covered about $108 billion. Swiss Re's comparable estimate puts global insured natural catastrophe losses at $107 billion, with wildfires, severe convective storms, and floods accounting for a record 92 percent of insured losses. The world was spared a direct U.S. mainland hurricane landfall in 2025, yet insured losses still exceeded $100 billion. Large loss years no longer require the old peak-risk trigger.
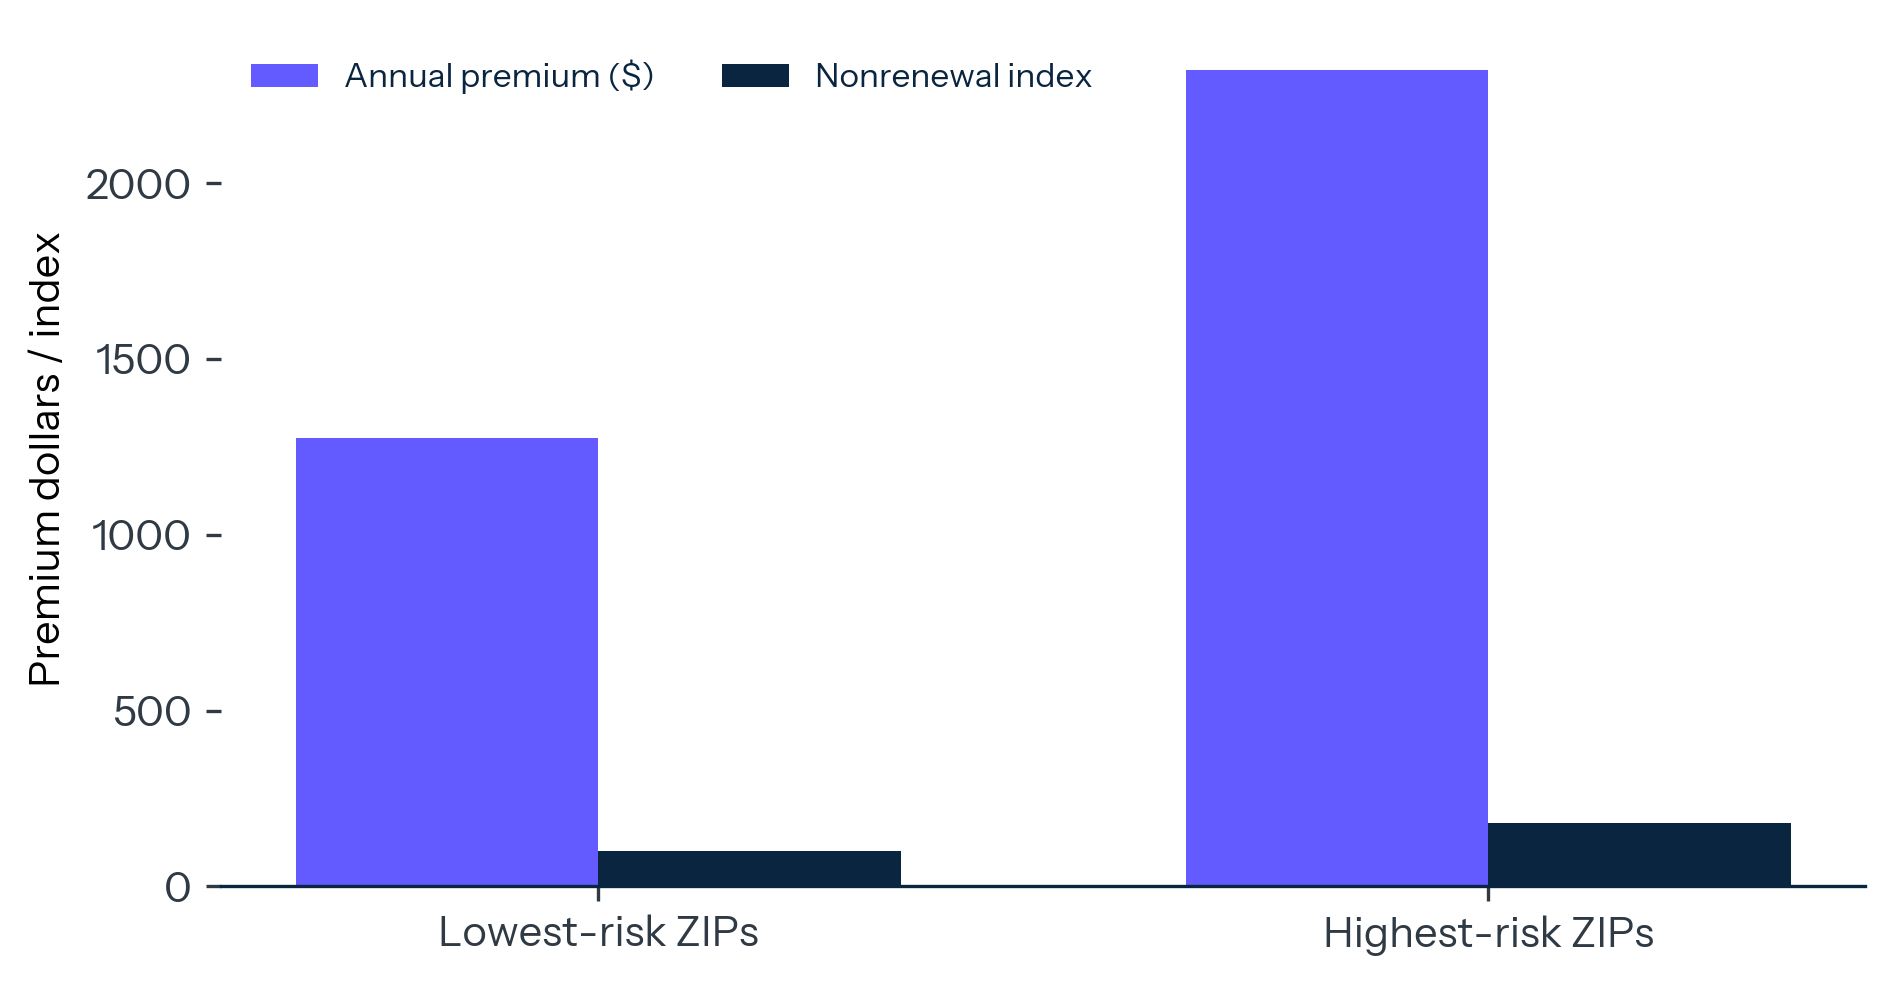
The United States shows how the transmission works. Homeowners insurance premiums rose about 70 percent nationally from 2019 to 2025, and insurance now represents 14 percent of the average monthly mortgage payment, up from 10 percent in 2013. Treasury's Federal Insurance Office found that households in the highest climate-risk ZIP Codes paid 82 percent more for homeowners insurance than those in the lowest-risk ZIP Codes, while nonrenewal rates were about 80 percent higher. Climate risk is now being priced one mortgage escrow account at a time, and insurability is becoming a local risk premium on real estate.
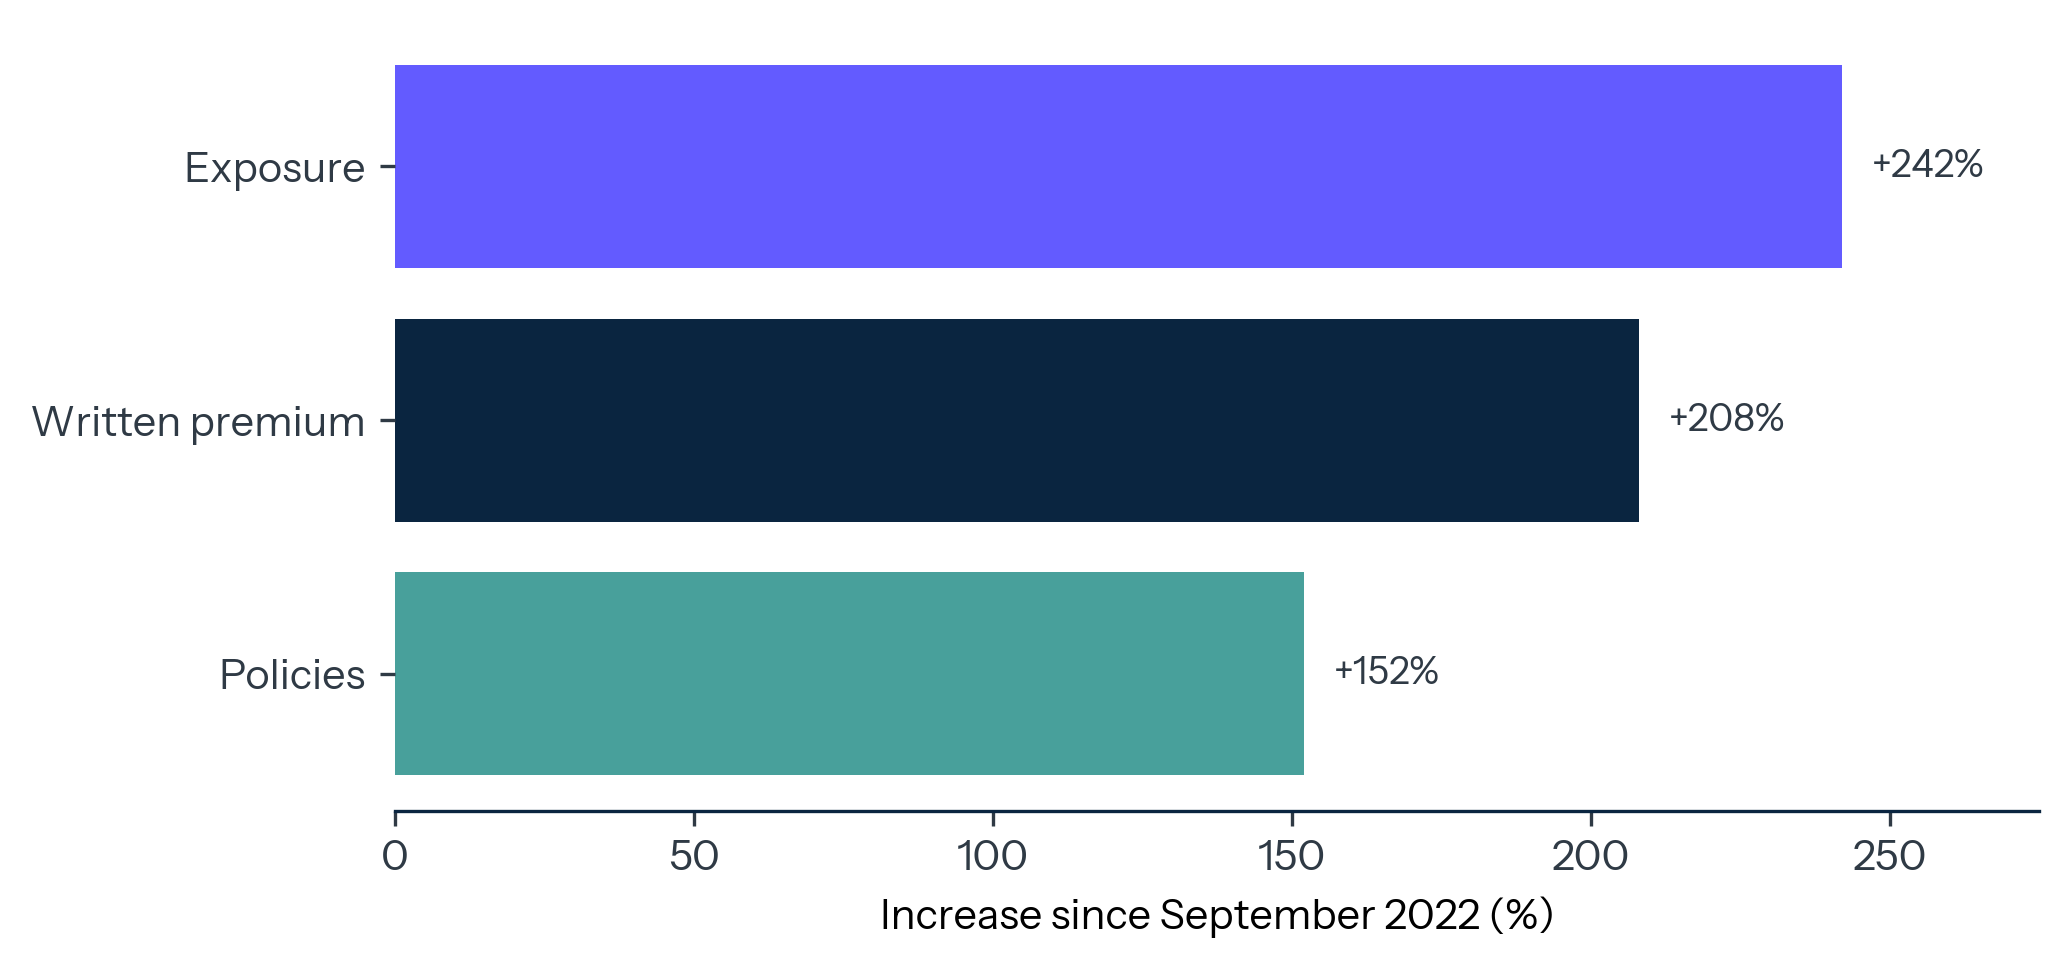
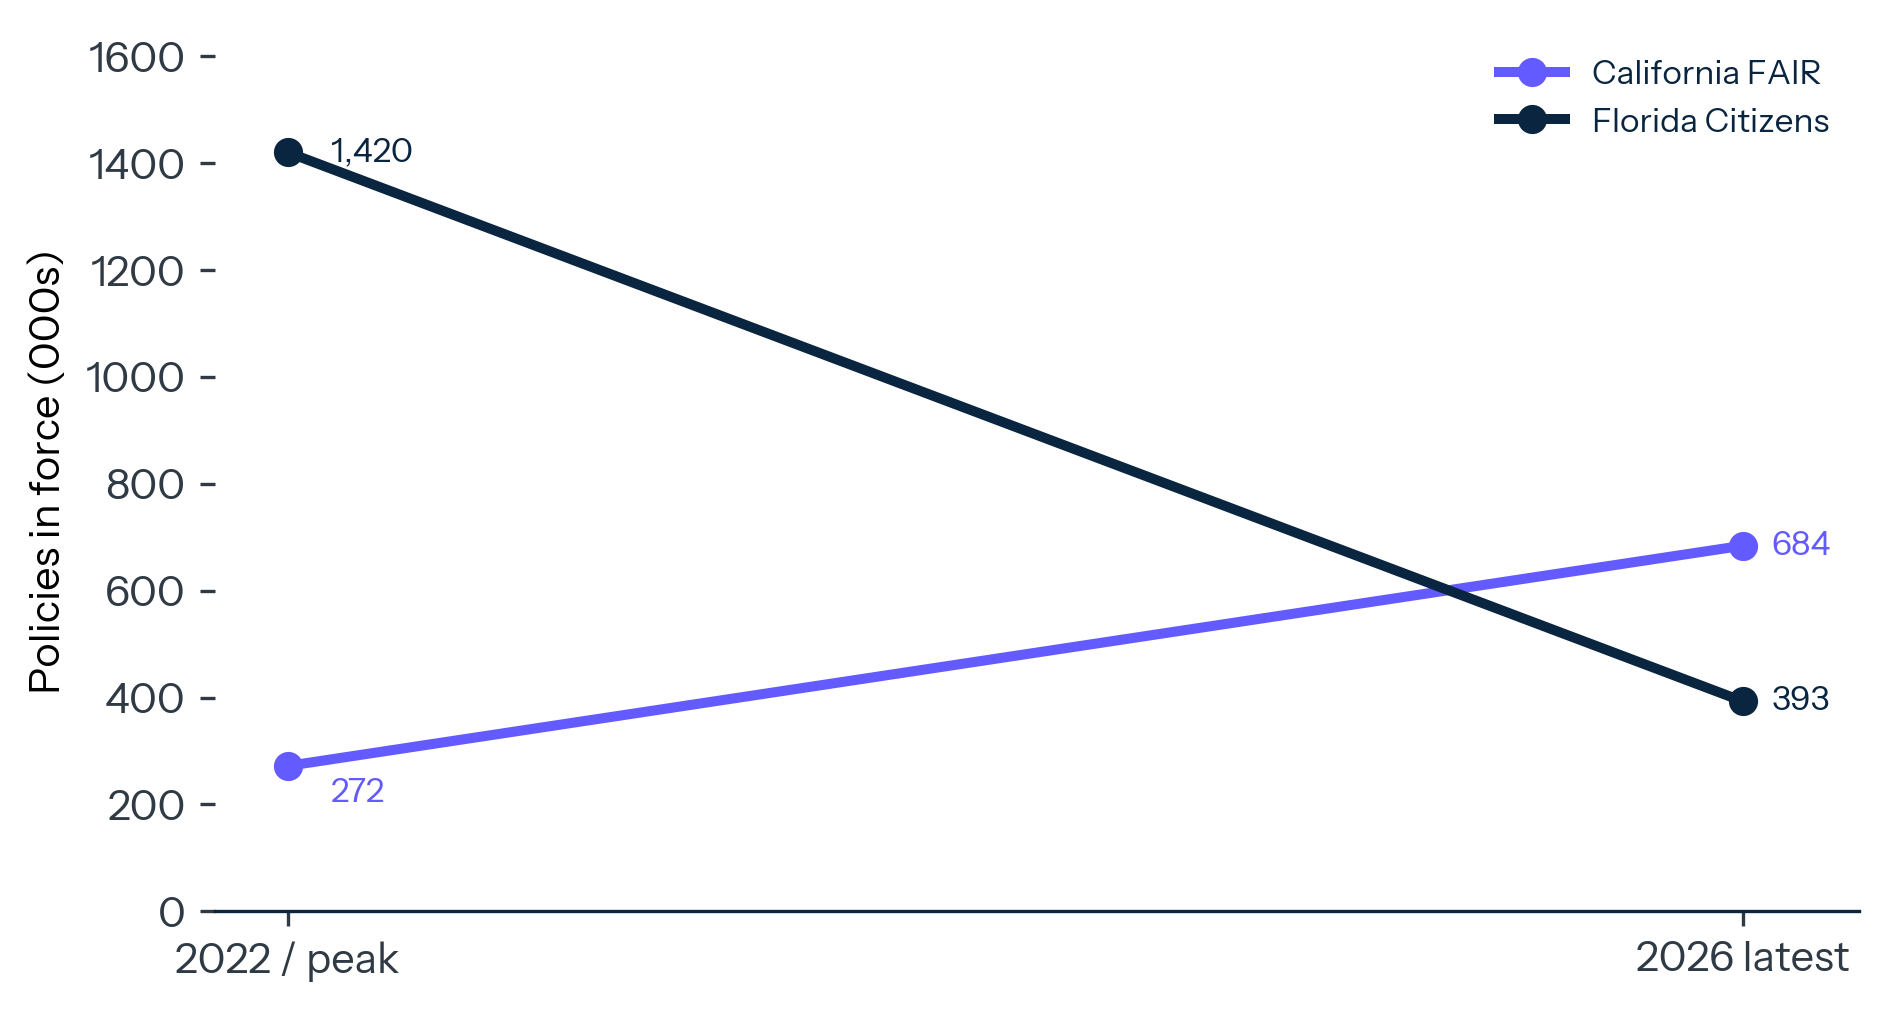
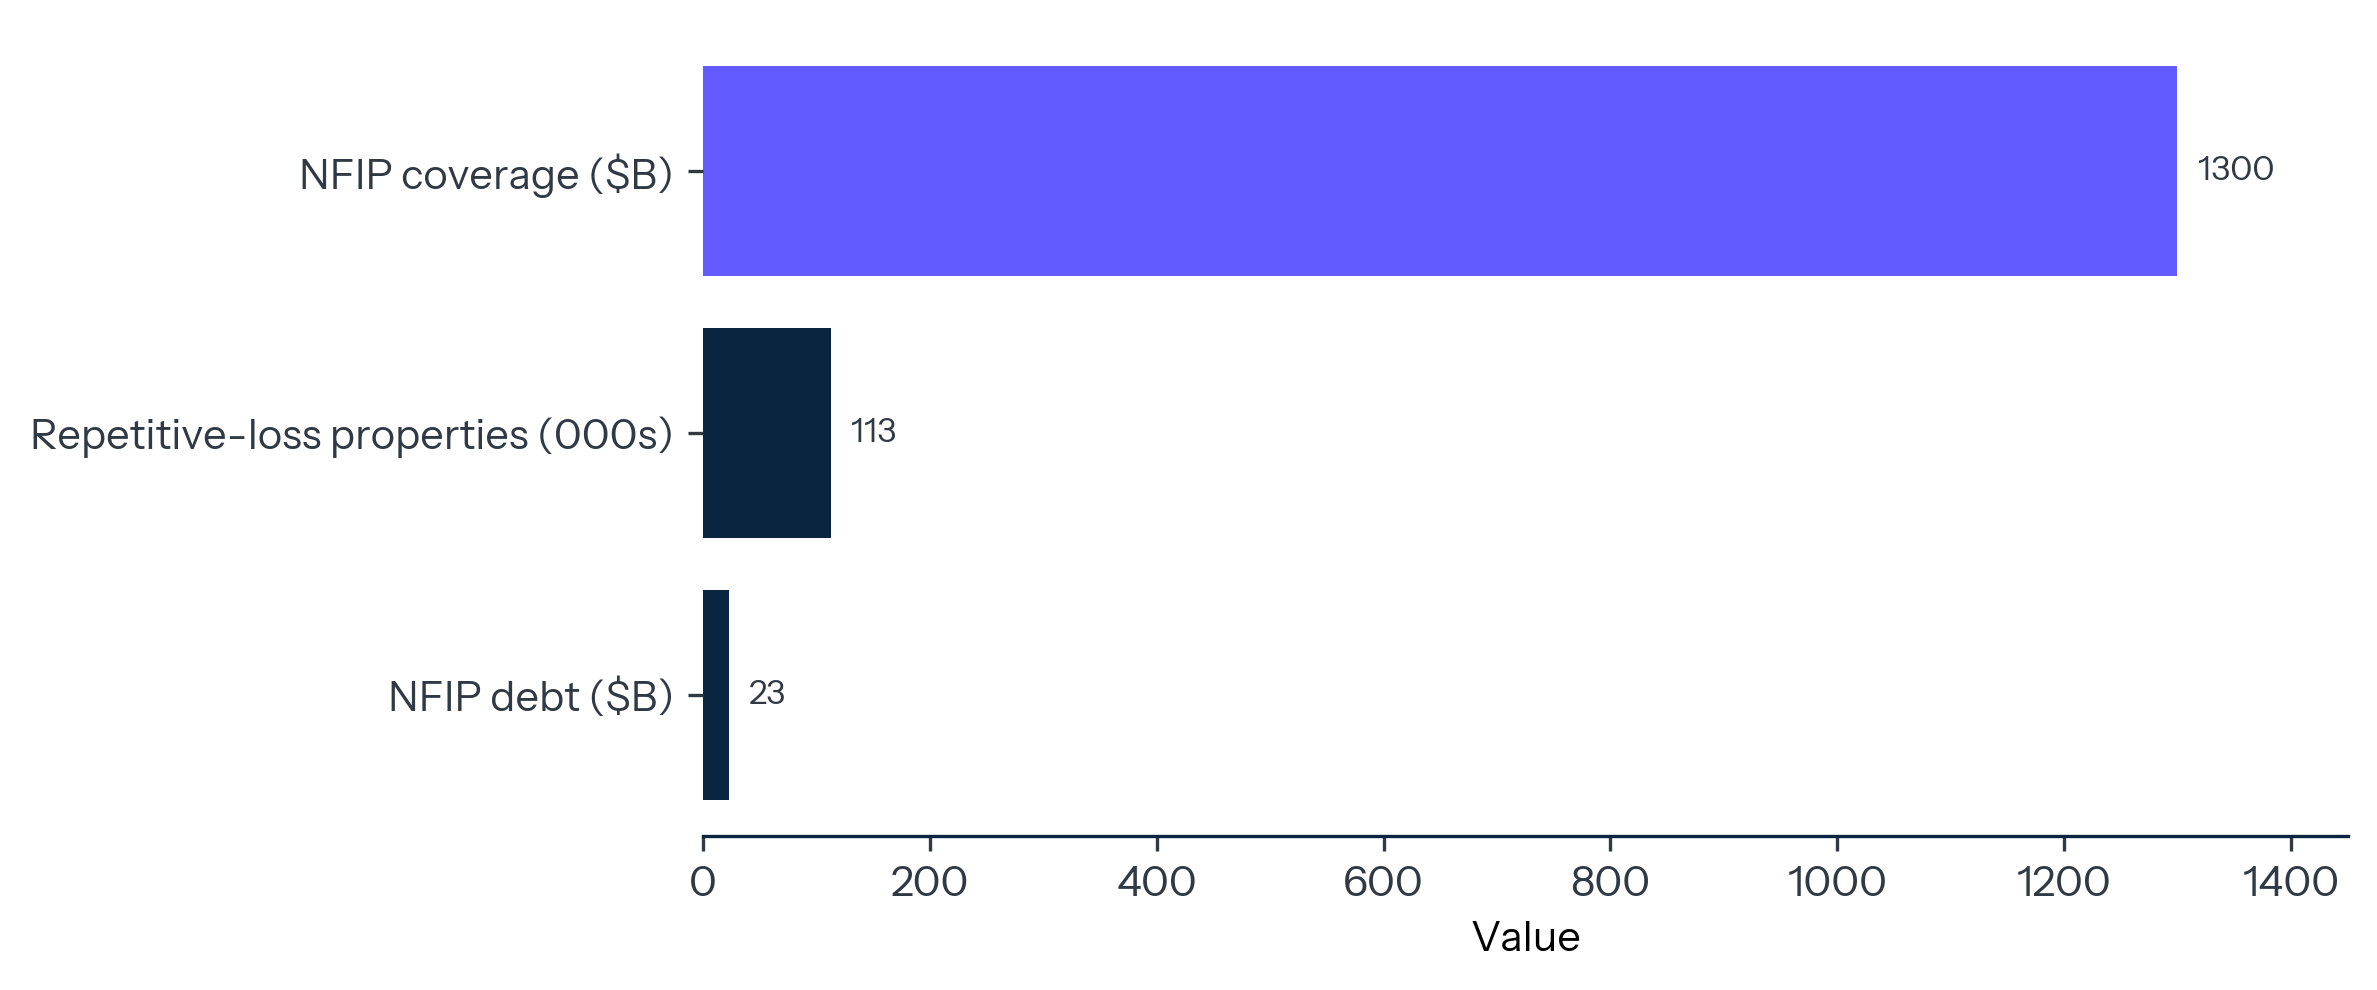
The consequence is a new geography of financial access. In California, the FAIR Plan reached $750 billion in exposure by March 2026, up 242 percent since September 2022. In Florida, Citizens Property Insurance has shrunk sharply after reforms and depopulation, a path that shows how much legal rules, reinsurance pricing, capital appetite, and public policy shape the boundary between private and public risk. Flood insurance is the older template: FEMA's National Flood Insurance Program provides nearly $1.3 trillion of coverage to 4.7 million policyholders while carrying debt, repetitive-loss exposure, and recurring political stress. Insurance is becoming the first line where climate risk becomes a balance-sheet constraint.
The break conditions are clear. The thesis weakens if private insurers re-enter high-risk ZIP Codes at adequate rates, if residual-market exposure contracts across multiple states without one-off legal changes, or if premium growth stops feeding through to delinquencies, relocation, and property-market discounts. Until then, the coverage map is the live risk map.
The Renewal Notice
Insurance has always been part of the machinery of homeownership. It protects the homeowner, protects the lender, and turns a risky structure into financeable collateral. For decades, that machinery was quiet enough to disappear into the monthly escrow line. The renewal notice matters because it is the first climate bill many households see, and it arrives even when the house has not burned, flooded, or lost a roof.
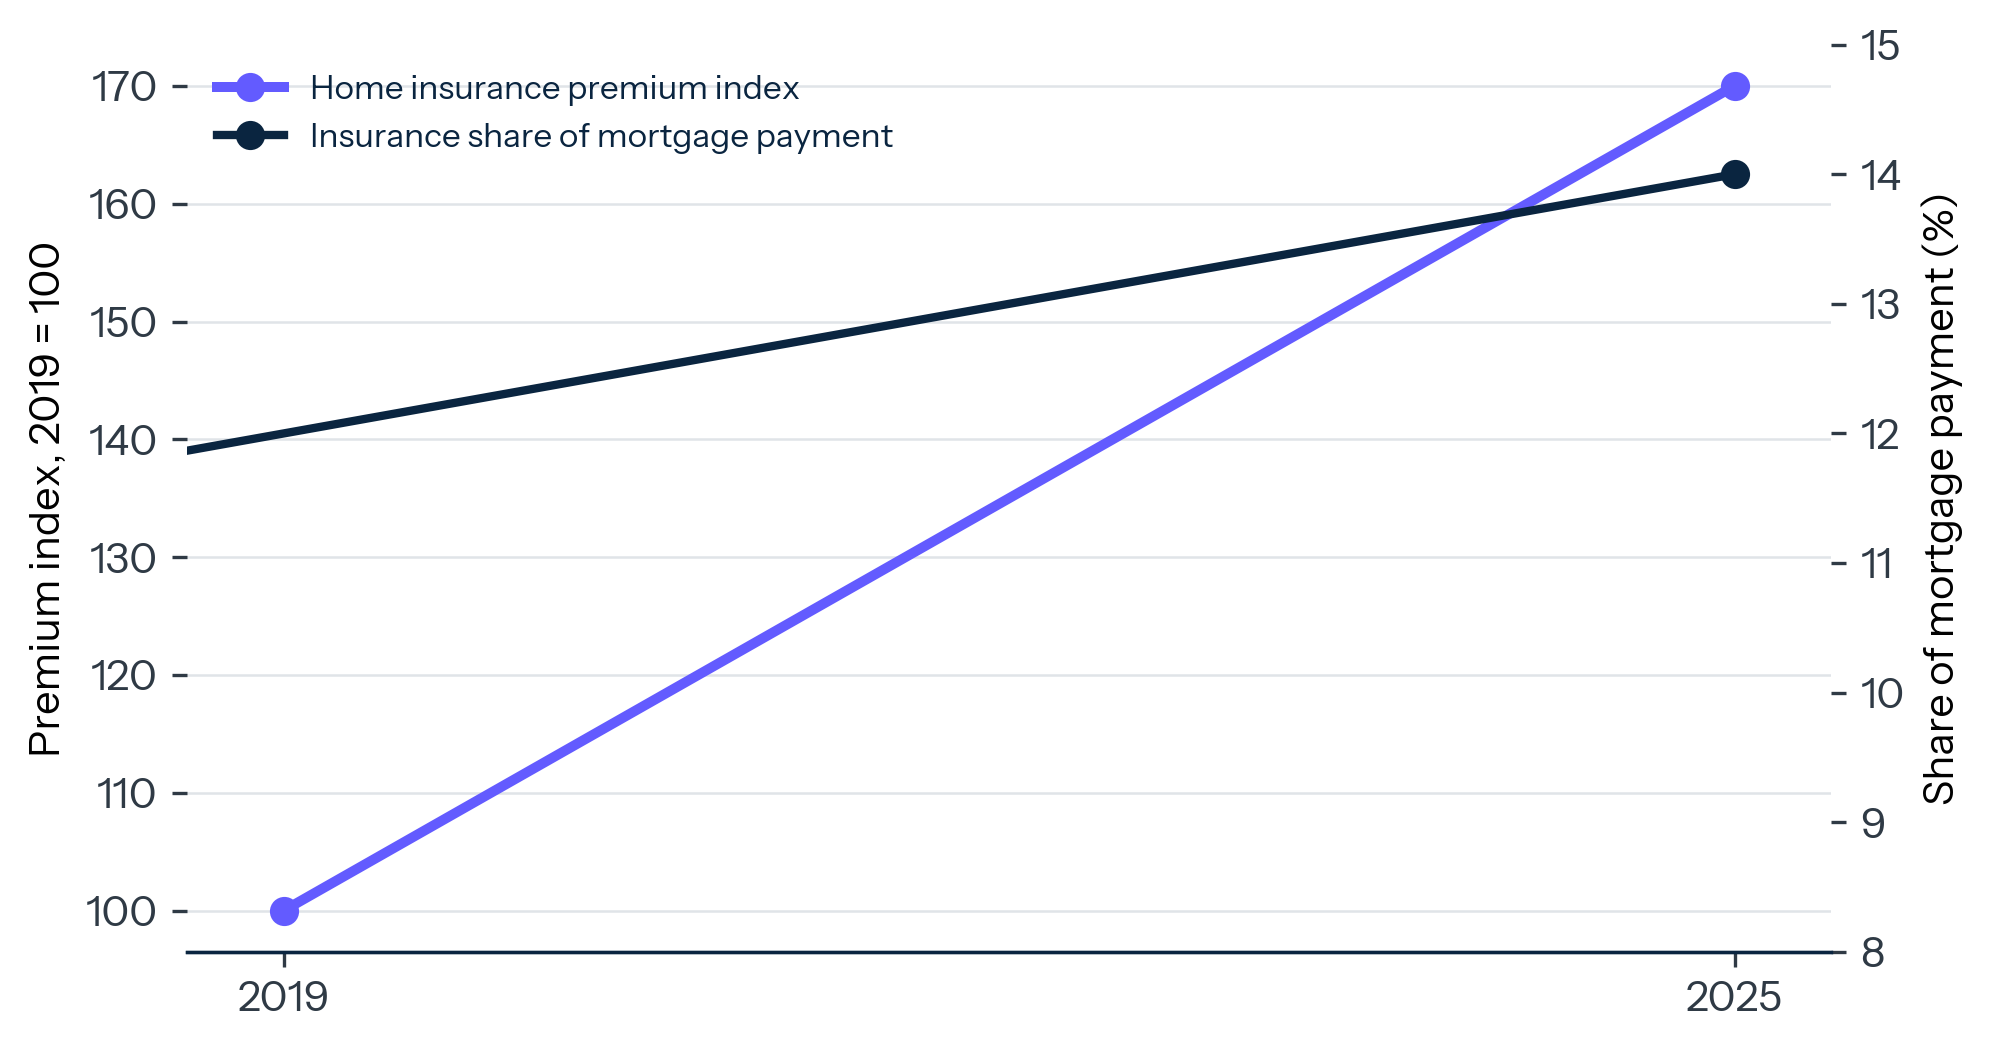
The Dallas Fed's 2026 research gives the cleanest read on the shift. Homeowners insurance premiums rose about 70 percent nationally from 2019 to 2025. Insurance represented 14 percent of the average monthly mortgage payment in 2025, compared with 10 percent in 2013.[^1] In a high-rate, high-price housing market, that shift matters. A household that can qualify for principal and interest can still be pushed outside affordability by taxes and insurance. The escrow account becomes the place where climate risk enters the household budget.
Exhibit 1: The Escrow Line Gets Bigger
Home insurance premiums rose about 70 percent from 2019 to 2025, lifting insurance to 14 percent of the average mortgage payment.
The effect is visible in mortgage data. Dallas Fed researchers, using mortgage-level ICE McDash data, linked insurance records with mortgage performance, credit reports, and relocation data. They found that a $1,000 increase in insurance premium rates corresponds to a 0.54 percentage point increase in the probability of relocation. They also found that premium increases pushed roughly 31,000 mortgages into delinquency in 2022 and projected that continued premium increases could produce an additional 203,000 mortgage delinquencies per year between 2025 and 2055.[^2]
The transmission channel is simple and severe. Climate risk becomes insurance cost. Insurance cost becomes housing cost. Housing cost becomes delinquency risk, relocation pressure, credit-card usage, and eventually property-market sorting. The premium can affect the household balance sheet before the disaster does.
The distribution is uneven. Financially secure households can respond by switching insurers, raising deductibles, buying mitigation, or moving. Constrained households have fewer options. They can absorb the premium, cut other spending, borrow on credit cards, fall behind on mortgage payments, or remain in locations where climate risk is increasingly expensive to insure. Over time, this creates a sorting mechanism that looks less like migration by preference and more like migration by insurability.
The mechanism matters for housing policy because insurance sits inside mortgage underwriting. Lenders require coverage, and the mortgage system relies on one premise: the collateral can be insured at terms that keep the borrower current and protect the lender after a loss. If coverage becomes unavailable, narrower, or materially more expensive, the mortgage market can lose the ability to function normally in specific ZIP Codes.
This is the new climate-credit link. The problem is often described as property owners facing higher premiums, but premiums are the visible price of a deeper institutional judgment about whether a pool of properties remains commercially coverable. When insurers retreat, the question moves from affordability to market structure. Who writes the policy. Who bears the tail. Who pays after the fire, flood, storm, or lawsuit. Who keeps the mortgage financeable when the private market decides the risk cannot be carried at a politically acceptable price. Public backstops are where that market-structure question is already being settled.
Attrition Replaces the Big One
The old mental model of catastrophe risk was built around peak events. A major hurricane makes landfall. A large earthquake strikes a metropolitan area. A single event defines the year. The model still matters, but it explains less of the loss pattern insurers are trying to price.
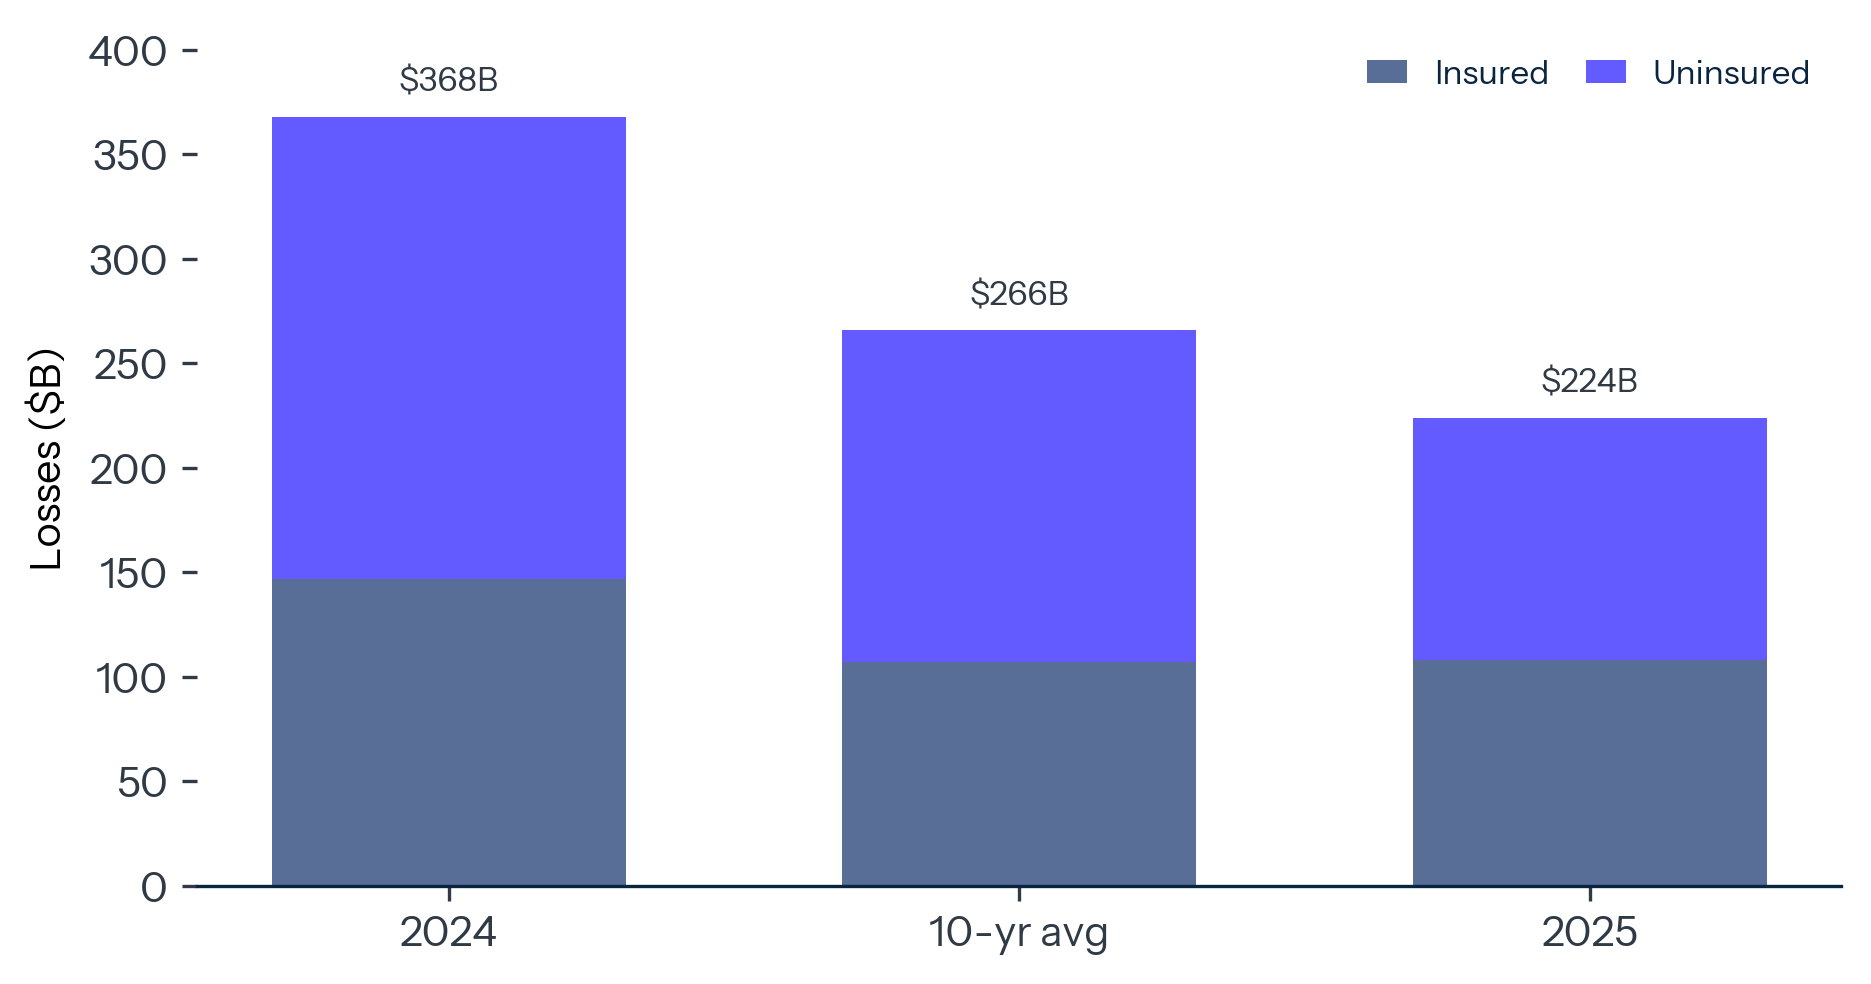
Exhibit 2: The Half-Insured World
Munich Re's reported-year releases show insured losses above $100 billion in both 2024 and 2025.
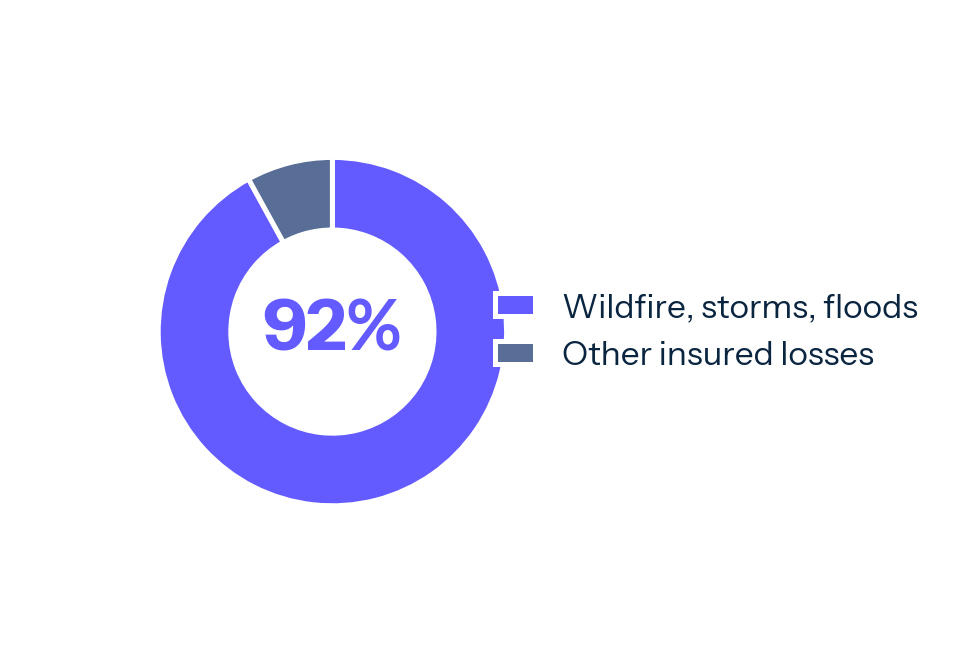
Munich Re reports that natural disasters caused about $224 billion in global losses in 2025, with insurers covering around $108 billion. Weather disasters accounted for 92 percent of all losses and 97 percent of insured losses. Non-peak perils, especially floods, severe convective storms, and wildfires, produced $166 billion in total losses, including about $98 billion insured.[^3] Swiss Re reports that secondary perils accounted for a record 92 percent of global insured natural catastrophe losses of $107 billion in 2025.[^4] The matching percentage is coincidental: Munich Re is measuring weather's share of all losses, while Swiss Re is measuring secondary perils' share of insured natural-catastrophe losses.
The numbers are important because the United States avoided a peak hurricane year in 2025. Munich Re notes that no hurricane struck the U.S. mainland for the first time in ten years. The system still generated more than $100 billion of insured losses. Severe thunderstorm losses in the United States reached $56 billion, of which $42 billion was insured, above the 10-year averages of $39 billion and $29 billion respectively.[^5] The Los Angeles wildfires alone generated about $53 billion in total losses and roughly $40 billion in insured losses, making them the costliest wildfire disaster to date.[^6]
The insurance problem is therefore broader than the spectacular event. It is the compounding of frequent, spatially dispersed, high-value losses. Severe convective storms hit roofs, cars, commercial structures, and public infrastructure across large regions. Wildfire risk expands at the edge of development. Flood losses accumulate through riverine, coastal, and intense-rainfall events. Each peril has its own physics. Insurers experience them through a common accounting frame: higher expected losses, higher volatility, higher reinsurance cost, higher reconstruction cost, and higher capital required to support the same book.
This is why the phrase "secondary perils" has become misleading. It describes their historical position inside catastrophe models while understating their current balance-sheet weight. A hurricane can still produce a defining loss year. Wildfires, thunderstorms, floods, and hail are now capable of keeping losses elevated without a named storm making landfall. The market is being repriced by attrition as much as by shock.
The shift changes how insurers manage the book. A peak hurricane can be isolated, modeled, reinsured, and reserved against as a concentrated tail event. Attritional losses are harder to quarantine because they arrive through thousands of claims across places that were never treated as the front line of catastrophe risk: roofs, vehicles, small businesses, municipal buildings, and suburban developments. The old model assumed diversification would do more of the work. The new loss pattern makes diversification less reliable because the same weather system can damage a wide geography at the same time.
It also changes the political economy of insurance. A single disaster produces a visible demand for recovery. Repeated premium increases produce a slower anger because the household receives the bill without the event. Pricing becomes harder to explain: insurers point to aggregate loss trends while homeowners experience a renewal notice on one address. The gap between actuarial evidence and household experience is where regulators, residual markets, and public subsidies enter.
Reinsurance turns that local anger into a global capital question. Primary insurers can absorb some volatility through underwriting, deductibles, and reserves. They still need catastrophe protection from reinsurers and capital-market investors. When attritional losses keep arriving, the wholesale market responds through higher attachment points, tighter terms, and higher prices. The household premium is the last link in that chain, but the signal often starts upstream.
The upstream signal is blunt. Capital will write catastrophe risk when it trusts the model, the legal regime, the rate process, and the diversification benefit. It pulls back when those assumptions weaken together. A hotter fire season, a more expensive roof claim, a slower rate filing, a larger legal tail, and a higher cost of capital can compound inside one underwriting decision. The insurer's retreat can look sudden to a homeowner because the renewal notice arrives once a year; inside the balance sheet, the repricing has been accumulating across every input.
The mechanism is exposure as well as hazard. Swiss Re emphasizes population growth, rising asset values, and reconstruction costs as factors increasing insured losses over time.[^7] Munich Re points to the same combination: climate change, growing values, more assets in exposed places, and high insured shares in regions such as North America.[^8] Climate is the hazard amplifier. Development is the exposure amplifier. Inflation and building costs are the claims amplifier. Insurance has to price all three.
Exhibit 3: The Perils Are No Longer Secondary
Wildfires and severe convective storms made up most of the secondary-peril loss base; floods were below their recent average.
Insurability depends on pooled risk. A peril can be covered privately when losses are measurable, diversified, and priced at a premium households and firms will pay. The difficulty rises when risks become correlated across geography, concentrated in high-value places, and politically hard to price. If a state regulator suppresses rates below expected loss, insurers reduce appetite. If insurers price fully, households and politicians demand relief. If reinsurers raise attachment points and rates after large losses, primary insurers pass those costs through or withdraw. The market becomes a negotiation over who absorbs the gap between actuarial risk and social affordability.
Treasury's ZIP Code data makes that gap visible.
The ZIP Code Price Signal
The most important U.S. insurance report of the past two years came from Treasury's Federal Insurance Office. The report moved the evidence base from state anecdotes to a nationwide ZIP Code level dataset covering more than 330 insurers and more than 246 million homeowners insurance policies from 2018 through 2022, an annual average of 49.3 million policies.[^9]
The finding was direct. Homeowners in the 20 percent of ZIP Codes with the highest expected annual losses from climate-related perils paid $2,321 in annual premiums on average from 2018 to 2022, 82 percent more than homeowners in the 20 percent lowest-risk ZIP Codes. Nonrenewal rates were also about 80 percent higher in the highest-risk ZIP Codes than in the lowest-risk ZIP Codes.[^10]
This is the uninsurable map in its early form: where the market is already charging more and renewing less. Insurance withdrawal often starts as friction, with larger premium increases, tighter underwriting, higher deductibles, narrower coverage, and more policies moved into residual markets. By the time households experience a formal coverage gap, the repricing has usually been underway for years.
The same report found that insurers' costs were higher in the highest-risk areas. Claim severity averaged about $24,000 in high-risk ZIP Codes compared with about $19,000 in low-risk ZIP Codes.[^11] This keeps the analysis grounded. Rising premiums reflect real claims costs, higher rebuilding costs, and a loss environment that has moved faster than many state-regulated rate structures. The friction emerges because households experience insurance as a bill, insurers experience it as expected loss plus capital cost, and regulators experience it as a public affordability problem.
The politics follow the accounting. If insurers are allowed to price risk fully, high-risk communities face premium shock, property-value pressure, and political anger. If insurers are blocked from pricing risk fully, they can reduce new business, decline renewals, narrow coverage, or shift capital elsewhere. If public backstops absorb the gap, taxpayers and policyholders inherit risks that private markets will not carry at regulated prices. Each route keeps homes occupied. Each route places the loss somewhere different.
The local-government channel is just as important. Treasury notes that homeowners insurance affects the value of homes and the tax bases of local governments.[^12] That sentence carries more weight than it appears to. Many local governments depend heavily on property taxes. If insurance costs reduce demand, depress prices, slow transaction volumes, or make mortgages harder to obtain, the fiscal effect arrives through lower assessments, higher delinquency risk, weaker development economics, and pressure for public spending after disasters. The insurance market becomes a leading indicator for municipal finance.
Exhibit 4: The ZIP Code Premium
High-risk ZIP Codes pay more and renew less often; the premium and nonrenewal gaps are shown on separate scales.
This is why insurance availability is more consequential than ordinary inflation. A higher grocery bill reduces disposable income. A higher insurance bill can alter the financing status of the asset that anchors household wealth and local public finance. The United States has built middle-class wealth, mortgage finance, school funding, and municipal solvency around the assumption that residential property is insurable collateral. Climate risk is testing that assumption unevenly, ZIP Code by ZIP Code, with California providing the largest current stress test.
The Last-Resort Balance Sheet
California's FAIR Plan was designed as an insurer of last resort. Its recent growth shows how quickly a residual market can become systemic when private underwriting appetite changes.
As of March 2026, the California FAIR Plan reported total dwelling and commercial exposure of $750 billion, up 8 percent since September 2025 and 242 percent since September 2022. Policies in force reached 684,388, up 152 percent since September 2022. Written premium reached $2.02 billion, up 208 percent over the same period.[^13] These numbers describe a public backstop that has become a central institution in one of the world's largest property markets.
The core driver is private-market retreat under wildfire stress. Insurers facing higher expected wildfire losses, more volatile reinsurance costs, regulatory constraints, and concentrated exposure have reduced appetite in specific areas. Households unable to find standard private coverage move to the FAIR Plan. The plan preserves access to insurance by concentrating risks that the private market has already screened. The insurer of last resort becomes the balance sheet of last resort.
The structure matters. Residual markets solve an immediate access problem by guaranteeing some form of coverage when private insurers withdraw. They also create a concentration problem. If the highest-risk properties move into a public or quasi-public pool, the pool becomes more exposed to a correlated event. If losses exceed resources, assessments, surcharges, borrowing, or state intervention become the next layer. The risk has moved into an institution with a public purpose and a political constraint.
California's position is especially difficult because wildfire risk sits at the intersection of climate, land use, vegetation, power infrastructure, rebuilding costs, and housing scarcity. The state needs insurance markets to function because the housing market already carries extreme affordability pressure. It also needs insurance prices to reflect enough risk to attract private capital. Those objectives can conflict. Too much price suppression reduces supply. Too much price adjustment generates political revolt. The FAIR Plan's expansion is the visible result of that tension.
The Los Angeles wildfires made the issue more acute. Munich Re estimates the event caused about $53 billion in total losses and about $40 billion in insured losses.[^14] Swiss Re places the combined insured losses around $40 billion as well.[^15] A single urban-edge wildfire event produced a loss comparable to a large hurricane, which matters for reinsurance pricing, insurer capital models, household perception, and the politics of rate adequacy. After a loss of that scale, the argument that wildfire is a fringe peril becomes untenable.
Exhibit 5: The Backstop Becomes the Market
California's residual market is adding policies, premium, and exposure at the same time.
California's difference is scale and visibility. Around the country, residual markets and state-backed mechanisms exist because private markets periodically fail to provide coverage at socially acceptable prices. Wind pools, beach plans, FAIR plans, flood programs, and guaranty structures all sit along the same spectrum. Their growth signals that more risk is being routed through public architecture. Florida shows how quickly that routing can change when policy, capital, and claims economics move together.
The Policy Variable
Florida's recent insurance story is often told as a comeback, and the evidence supports the label. Citizens Property Insurance Corporation reported that its policy count peaked at 1.42 million in October 2023. Citizens also reported that its 2025 depopulation program transferred more than 546,000 policies to private insurers approved by the Florida Office of Insurance Regulation.[^16] By January 2026, the count had fallen to 392,689, roughly 72 percent below the peak.[^17]
The reversal is striking for a state that had become shorthand for property-insurance dysfunction. Litigation reforms, regulatory changes, new entrants, depopulation, and recent storm experience have helped shrink the public backstop. Citizens' board approved 2026 rate recommendations that would reduce average personal-lines rates for the first time since 2015.[^18]
Florida therefore complicates a simple retreat story. Markets can recover if legal costs fall, capital returns, rates improve, and public policy changes the expected economics of underwriting. Litigation rules, regulatory credibility, reinsurance availability, capital-market appetite, policyholder behavior, loss history, and climate hazard all shape the boundary between private and public insurance.
The lesson is that insurance stress has more than one driver. Climate hazard is central. Claims inflation, legal incentives, rebuilding costs, fraud, regulatory lag, and reinsurance cycles also matter. A state can ease one layer of stress while remaining exposed to another. Florida can depopulate Citizens and still remain deeply sensitive to hurricane landfalls, reinsurance pricing, and household affordability. California can reform rate rules and still face a wildfire exposure problem that grows with development and reconstruction costs.
This distinction matters for national policy. A purely climate-centered account misses the institutional levers that can improve availability. A purely litigation-centered account misses the physical risks that make capital more expensive. The insurance crisis is a systems problem. It has meteorological inputs, legal inputs, capital-market inputs, construction-cost inputs, and political inputs. Fixing one does not repeal the others.
Florida's path also raises a question about private-market return. When policies leave Citizens, the risk moves back to private balance sheets. The structure is healthier when premiums are adequate, insurers are capitalized, and consumers retain meaningful choice; it is fragile when risk is transferred to weak carriers, reinsurance protection is thin, or policyholders are moved faster than the underlying market can absorb. Depopulation tests whether private capital is being paid enough to hold the risk through the next loss cycle.
The deeper comparison between California and Florida is therefore about who holds the risk after the market adjusts. California is moving more risk into the residual plan. Florida is moving more risk out of Citizens. Both states are negotiating the same question: when climate-exposed property remains economically important and politically sensitive, what mix of private capital, public backstop, and household payment can keep it insured.
The federal flood program is the older template for this kind of public risk transfer.
Exhibit 6: Two Maps of Retreat
California and Florida moved in opposite directions over different windows; the chart compares policy direction, with dates shown for each endpoint.
The Federal Template
The National Flood Insurance Program is the older version of the climate-insurance problem. It exists because private flood insurance had limited capacity to support access to mortgages and disaster recovery across flood-prone communities. It keeps properties financeable. It spreads risk through a federal structure. It also shows how hard it is to price recurring climate exposure when affordability, development patterns, and political expectations are already built around coverage.
FEMA says the NFIP has more than 4.7 million policyholders and provides nearly $1.3 trillion in flood coverage.[^19] Those figures describe a program that functions as financial infrastructure. Without flood insurance, many properties in Special Flood Hazard Areas would struggle to satisfy mortgage requirements. Without a federal program, many households would face either no coverage or premiums that more directly reflected expected losses. The NFIP is therefore a housing-market institution as well as a disaster-insurance program.
The fiscal strain is longstanding. The Congressional Research Service reported NFIP debt of $22.525 billion and remaining borrowing authority of $7.9 billion.[^20] GAO reported in 2026 that 112,640 repetitive-loss properties represented about 2.5 percent of NFIP policies as of January 2026. [^21] Repetitive-loss properties are the concentrated arithmetic of the program: a small subset of structures produces repeated claims, while public policy has to decide whether to keep rebuilding, raise premiums, mitigate, elevate, buy out, or restrict future exposure.
Flood matters because it reveals the end state when private risk transfer and social expectations diverge. The program preserves access and resilience while socializing part of the cost of living in flood-prone places. Risk Rating 2.0 tried to make premiums more actuarially informed, and the political pressure around affordability remains. The basic tension persists. If premiums reflect risk, some households face large increases. If premiums are capped, taxpayers and future policyholders carry more of the burden.
This same structure is now appearing in wildfire and wind. The peril changes. The institutional problem repeats. Private capital can carry a great deal of catastrophe risk, especially through reinsurance and insurance-linked securities, provided it has price, diversification, and confidence in the rules. Public policy can preserve coverage without making expected losses disappear. Subsidies can slow household stress while dulling incentives to reduce exposure. Buyouts and mitigation reduce risk slowly, locally, and with political difficulty.
The flood template also shows that insurance shapes pre-disaster land use. If insurance is available and underpriced, development can continue in exposed places. If insurance becomes unavailable or expensive, development slows or shifts. If public backstops fill the gap, the risk remains financeable even when private markets would send a stronger warning. Insurance is therefore a price signal, a social safety net, and a land-use subsidy at the same time.
Reform is hard because every clean answer falls short somewhere. A pure market solution can produce politically unacceptable dislocation. A pure subsidy solution can increase long-run exposure. A pure mitigation solution requires time, capital, enforcement, and local consent. The realistic path is a disciplined mix: risk-based pricing where households can absorb it, targeted affordability support where they cannot, stronger mitigation standards where coverage is scarce, and more willingness to stop rebuilding the same loss in the same way.
Exhibit 7: The Federal Flood Ledger
NFIP keeps property financeable at national scale, while debt and repetitive-loss exposure show the cost of carrying risk publicly.
The Public Ledger
Insurance retreat reallocates climate losses, and the fiscal geography is the map underneath.
When private insurers reduce exposure, households carry more risk through higher premiums, lenders carry more collateral risk, local governments carry more tax-base risk, and public programs carry more disaster risk. The temptation is to treat this as a consumer-protection problem. Homeowners do need coverage they can afford, understand, and rely on, but the larger issue is macro-financial: insurance is the plumbing that lets property risk become credit.
The OECD's 2026 work on financial protection against catastrophic risks makes this point through the lens of public-private programs. Governments need to assess when private insurance markets can provide adequate protection, when public intervention is needed, and how to design programs that preserve incentives for risk reduction.[^22] The ECB and EIOPA made a similar argument in 2023 for Europe, where only about one quarter of climate-related catastrophe losses were insured. [^23] A protection gap is therefore also a credit gap. Assets that cannot be insured are harder to finance, communities that cannot finance adaptation become more exposed, and public budgets become the absorber of last resort.
The timing problem is what makes the ledger dangerous. Premiums can reset annually, property values adjust slowly, and public budgets often react after the disaster. Risk first appears as insurance friction, then as household stress, then as market repricing, then as fiscal exposure. By the time a city sees the tax-base effect clearly, the insurance market has often been sending warnings for years.
Local and state leaders have strong incentives to preserve development, assessments, and affordability; federal leaders have strong incentives to provide disaster relief after visible events. Those incentives are understandable, but together they can keep capital flowing into places where expected losses are rising faster than risk reduction. The investment implication is straightforward: insurability is becoming a local risk premium affecting housing demand, municipal revenue, mortgage performance, bank exposure, and state fiscal capacity.
The Insurability Test
The insurance phase of climate risk forces a harder test than whether losses are rising. Losses are rising. The test is whether societies can reduce risk faster than the price of risk rises.
Adaptation has to be judged by that standard. Stronger codes, defensible space, roof standards, floodproofing, drainage, land-use discipline, vegetation management, grid hardening, and buyouts all change the expected loss distribution. They can make risk more insurable by reducing severity, frequency, or uncertainty, and insurance can then become a reward mechanism: lower risk should produce better access, lower premiums, or greater private-market appetite.
Timing is the obstacle. Premiums can reprice in a renewal cycle and reinsurance can reprice at January 1, while building stock and land-use patterns change over decades. A household can receive a 40 percent premium increase this year because a risk model changed, while the mitigation work needed to reduce that risk may require years of permits, contractors, standards, and capital. The insurance market moves at financial speed. The built environment moves at physical speed.
Subsidies are defensible when they prevent forced displacement and buy time for mitigation or relocation. They become dangerous when they hide risk inside undercapitalized public pools. Policy design has to separate affordability from risk suppression with one disciplined package: support people explicitly, disclose the risk honestly, capitalize public backstops for the exposure they hold, tie assistance to mitigation or relocation where possible, and monitor availability and nonrenewal as the sharper signal of market retreat.
The private sector has an equal role. Insurers need credible regulatory pathways to earn adequate rates in exchange for continued availability. Lenders and mortgage investors need to monitor premium shock, nonrenewal, residual-market dependence, and flood risk as collateral variables. Developers and municipal-bond investors need to price insurability into site selection, construction standards, and tax-base assumptions.
The best outcome is insurable resilience: properties and communities that can attract private capital because the underlying risk has been reduced, priced, and disclosed. More coverage that protects growing exposure without reducing risk can deepen the long-run problem. Insurable resilience is a higher standard than coverage access alone.
Implications
Housing affordability and mobility. Mortgage rates and home prices still dominate, but insurance is now large enough to change qualification, delinquency risk, and location choice. In high-risk markets, the relevant monthly payment is principal, interest, taxes, insurance, and future premium uncertainty. Repeated renewal shocks will show up as slower household formation, thinner buyer pools, and more families treating coverage stability as part of the location decision.
Residual markets and public balance sheets. When FAIR plans, Citizens, wind pools, or flood programs expand rapidly, they reveal private-market discomfort before property prices fully adjust. Every time private insurers narrow appetite, another institution absorbs the exposure: a household through a higher deductible, a state residual market through concentrated risk, or the federal government through flood insurance and post-disaster aid. Backstop growth should be read as a market signal before it becomes a fiscal surprise.
Municipal finance and property valuation. Insurability is becoming a discount rate on local real estate. Two homes with the same income profile, school district, and mortgage rate can carry different economic values if one sits in a market with stable insurance and the other depends on a residual plan. That discount will appear first in slower transactions, wider bid-ask gaps, and more cautious lending before it appears in headline price indices. Local governments that ignore insurance availability are ignoring a leading indicator of tax-base stress.
State policy. Florida's recent experience shows that legal and regulatory reforms can attract capital and shrink a public backstop. California's experience shows that physical hazard and market concentration can overwhelm residual structures quickly. Policy can change the one-year trajectory. Expected loss still governs the decade. Insurance converts risk into a bill, which makes climate politics immediate: voters can absorb abstract climate risk for years and then revolt over one renewal notice.
Adaptation. Mitigation that lowers expected loss can preserve insurance access, property values, and credit availability. Adaptation spending should be evaluated partly by whether it keeps private insurance capital in the market. The practical test is whether the project makes the property easier to insure at a durable price.
Mortgage credit and bank supervision. Insurance stress should be treated as a collateral variable. A lender that monitors debt service while ignoring premium shock is missing a growing source of delinquency and refinancing risk. Regulators should watch premium growth, nonrenewal, residual-market dependence, and coverage gaps as practical indicators of collateral deterioration.
Reinsurance and capital markets. The retail premium is downstream of a wholesale price. If reinsurers demand more capital for wildfire, flood, or convective-storm exposure, primary insurers have three choices: raise rates, narrow coverage, or write less business. Insurance-linked securities can add capacity, but they will not absorb mispriced risk indefinitely. The cost of capital will increasingly determine which places remain privately insurable.
Equity and economic development. Risk-based pricing is economically coherent and politically hard. Wealthier households can absorb premiums, self-insure larger deductibles, retrofit homes, or move. Lower-income households face the same signal with fewer choices. States that want housing growth, grid expansion, semiconductor plants, data centers, or logistics hubs also need functioning insurance markets. Insurability is becoming part of economic development capacity.
What to Watch
The first variable is residual-market exposure. California FAIR Plan exposure, Citizens policy count, state wind-pool growth, and other insurer-of-last-resort metrics will show whether private appetite is returning or retreating. The direction matters more than the press release.
The second variable is nonrenewal and new-business restrictions. Premium increases get attention. Availability is the sharper signal. When insurers continue renewals only with tighter terms, or stop writing new policies in exposed ZIP Codes, the market is moving from price adjustment to coverage rationing.
The third variable is reinsurance pricing. Primary insurers need catastrophe protection at viable terms to offer affordable coverage. Reinsurance renewals are the wholesale price of climate risk.
The fourth variable is mortgage performance in high-premium ZIP Codes. Rising delinquency linked to insurance cost would confirm that climate risk is moving through credit channels before the next disaster loss.
The fifth variable is public-backstop exposure. Programs that grow quickly can maintain coverage in the short run while shifting the fiscal burden to policyholders, taxpayers, or future disaster budgets.
The climate economy is being priced first through insurance. That makes the issue less abstract and more immediate. The question for households is whether they can keep coverage. The question for lenders is whether collateral remains financeable. The question for local governments is whether the tax base can absorb the premium shock. The question for states is whether public backstops can carry risks private markets are reducing.
The uninsurable map will appear as higher premiums, thinner coverage, more nonrenewal, larger residual markets, rising deductibles, stressed mortgages, slower transactions, and larger public backstops. Those signals are already visible. The places that adapt fastest will preserve insurability. The places that rely on hidden subsidies will preserve occupancy while accumulating fiscal risk. Insurance is becoming the market's climate audit.