Human Robots

The chart below highlights the central economic, political, and societal challenge in America. On a human level, this chart and what it represents is tearing at our country’s seams.
The Break
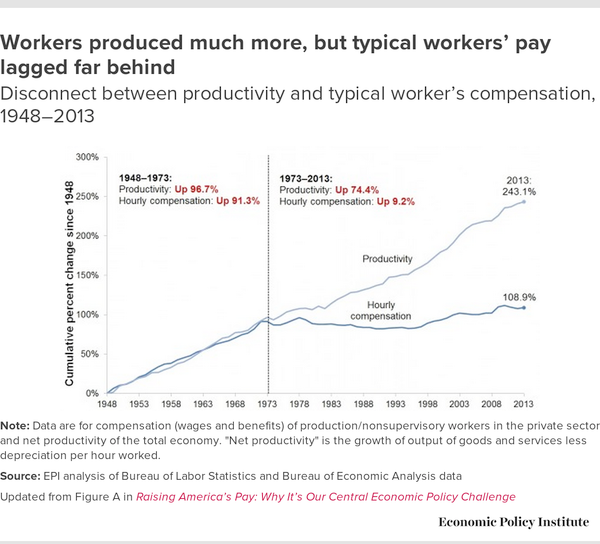
From 1948–1973, Ms. Worker’s received pay commensurate with what she produced.
Channeling Richard Feynman, you could easily explain to a child Ms. Worker’s experience from 1948–1973: she was fairly paid.
Since 1973, though, Ms. Worker’s productivity has increased by three-fourths, but her pay has increased by less than ten percent.
A child would call Ms. Worker’s situation unfair.
Because it is (and yes, I understand globalization, productivity, and markets).
As software and artificial intelligence consume cities, Ms. Worker deserves better than to be treated as a work-but-don’t-reward robot.
If not, she and her 100 million friends will have some harsh things to say to their unfair overlords.