The Great Energy Surge
We've never stopped using anything.
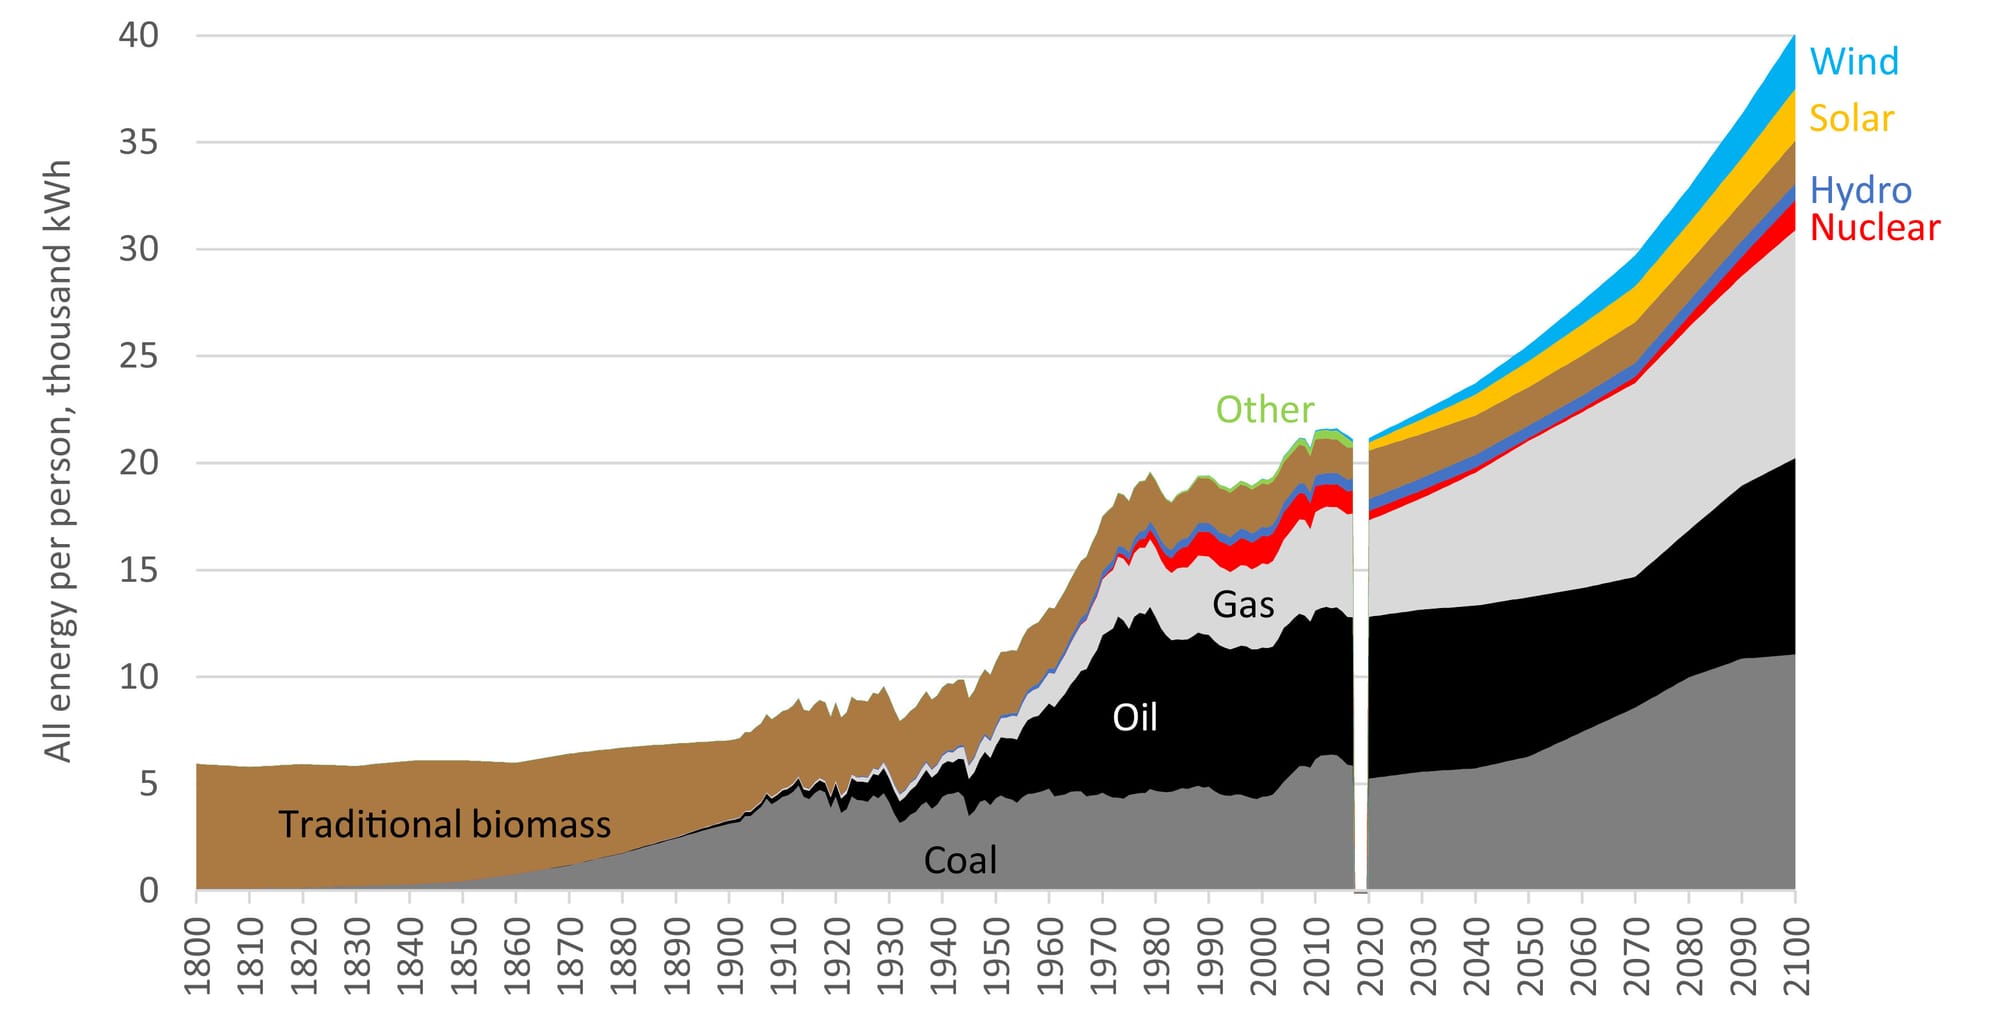
Look at the chart below. Two hundred years of energy history, stacked like sediment. Traditional biomass sits at the bottom—still there. Coal arrives in the 1850s and booms. Oil appears around 1900, another layer. Natural gas follows. Nuclear adds itself in the 1970s. Wind and solar climb steeply after 2000.
Notice what's missing: decline. No energy source shrinks as new ones arrive. They stack. Humanity hasn't transitioned between fuels—we've added them. Every single one. The result is visible in the numbers: from 5,000 kilowatt-hours per person annually to nearly 40,000. An eightfold increase in two centuries, achieved by piling new sources on top of old ones rather than replacing anything.
The Addition Fallacy
Politicians talk about energy "transitions" as though we regularly swap one fuel for another. We've never successfully transitioned away from an energy source at global scale. We've only added.
Traditional biomass—wood, waste, dung—still anchors the bottom of the chart in 2100. It hasn't vanished despite two centuries of "progress" into coal, oil, and gas. About 2.4 billion people still cook and heat with it. Coal consumption hit a record in 2023, not 1923. Oil demand keeps climbing globally even as wealthy nations cut back. Natural gas has been the fastest-growing fossil fuel over the past 20 years.
Wind and solar expanded faster than any previous energy source at comparable stages. Solar costs dropped 90 percent since 2010. Wind achieved similar gains. Both now compete economically with fossils in many markets.
But that expansion happened while every other source grew too. Renewables didn't displace coal, oil, or gas—they supplemented them. The world added renewables at record pace, and global fossil fuel use still hit new peaks.
The Net-Zero Problem
Current climate commitments require something unprecedented: not just adding renewables rapidly, but actively shrinking fossil fuel use while meeting growing energy demand. The chart shows we've never done anything like this. We've mastered expansion. We've never mastered contraction, especially while billions lack reliable modern energy.
The math gets harder with development. Global population hit 8 billion in 2022 and continues rising. Energy use per capita in developing nations is far below levels in wealthy countries. India uses roughly one-quarter of the global average. Sub-Saharan Africa uses even less. As these economies develop, total energy demand could surge even with aggressive efficiency gains.
Speed vs. Scale
Each previous energy source needed 50 to 100 years to reach significant global share. Coal took roughly 70 years from initial adoption to become major. Oil required similar time. Nuclear, despite massive Cold War government support, never exceeded 20,000 kWh per capita globally and plateaued after 1990.
Wind and solar must now accomplish in 25 years what previous sources needed a century to achieve—while simultaneously retiring fossil infrastructure worth trillions. This is the difference between addition and substitution. Addition means building new capacity. Substitution means building new capacity and deliberately destroying existing assets that still make money.
Limited Transitions
Britain cut coal substantially between 1990 and 2020 by shifting to natural gas. France built its nuclear fleet rapidly in the 1970s and 1980s, creating one of the lowest-carbon electricity systems among major economies. Denmark generates over half its electricity from wind.
These examples work under specific conditions—wealthy nations, stable institutions, technical capacity, willingness to accept transition costs. They also typically involve switching between fuels rather than using less energy total. Britain replaced coal with gas, not coal with conservation. France replaced coal and oil with nuclear, not fossil fuels with efficiency.
Scaling to global level hits different constraints. The world can't just shift coal to gas like Britain, because carbon budgets require cutting all fossil use. We can't replicate France's nuclear pace given current costs, timelines, and opposition. Denmark's wind success partly depends on exporting surplus and importing during calm—doesn't work for isolated grids or global systems.
Breaking Through
Battery storage costs dropped 90 percent since 2010, potentially solving renewables' intermittency. Electric vehicles are accelerating across multiple markets. Heat pumps now compete economically with gas furnaces in cold climates. Green hydrogen production costs are falling as manufacturing scales. Advanced nuclear designs promise safer, cheaper, faster construction.
Each technology could help break the addition pattern. Each also faces headwinds. Battery production requires massive mineral extraction—supply chain and environmental questions. EVs need charging infrastructure and grid upgrades. Heat pumps demand large upfront investment and don't work everywhere efficiently. Green hydrogen remains expensive versus fossil alternatives. Advanced nuclear hasn't proven commercial viability at scale.
Winners and Losers
The hardest challenge isn't in the chart—it's in the politics. Energy addition created winners without creating losers. Entrepreneurs built oil companies without destroying coal companies. Engineers developed nuclear without shutting gas plants. Investors financed wind farms without stranding assets.
Energy subtraction creates enemies. Coal miners lose jobs when plants close. Oil nations lose revenue when demand falls. Gas utilities lose customers when buildings electrify. These losses concentrate in specific places and populations, creating organized opposition.
This explains why carbon pricing remains limited despite decades of advocacy. Why fossil subsidies persist despite climate commitments. Why coal hit record highs in 2023 even as renewable capacity expanded. Adding renewables creates constituencies who want more. Subtracting fossils creates constituencies who fight back.
Charting History
Two hundred years of energy history teaches one lesson: we're excellent at expanding supply, terrible at contracting it. The transition ahead requires something different—not just technological innovation, but also innovation in how we make energy disappear while maintaining prosperity and stability.
The chart offers no certainty about whether progress happens. It does offer clarity about scale, though. The gap between current trajectory and required trajectory is the distance between the chart's edge and net-zero. Closing it means breaking patterns that held for two centuries.
We know we can add energy sources quickly. The question is whether we can subtract old ones fast enough, and history shows no examples at the required scale.
Right now, we’re writing the next chapter of energy history.