The New York Premium
New York City's mobility and safety have never looked better. Its affordability has never looked worse.
A short intelligence memo on Cities Infrastructure. Read for the core judgment, evidence trail, and decision implication.
New York City's mobility and safety have never looked better. Its affordability has never looked worse.
- Frame
- Briefing
- Topic
- Cities Infrastructure
- Access
- Free
A single chart has been making the rounds. It shows NYC Ferry ridership is running roughly 30 percent above its 2019 level, a clean upward line that survived the pandemic, fare increases, and the long hollowing-out of the five-day office week. It is a real and impressive number. But read in isolation, it flatters. The ferry is the most visible expression of a deeper pattern, and the pattern is more interesting — and more complicated — than the line suggests. New Yorkers are moving more than they ever have. They are also safer than they have been in generations, and paying more for the privilege of staying than at any point in the modern history of the city. The recovery is real. So is the bill. And the gap between the two has become the central fact of New York's politics.
More Motion, Different Modes
Start with the water, because that is where the story began. NYC Ferry carried more than 7.4 million passengers in fiscal 2025, its highest annual total ever, and in August 2025 cleared one million boardings in a single month for the first time in the system's history.1 Waterfront demand in Greenpoint, Williamsburg, and the rebuilt Brooklyn and Queens shorelines is structural, not seasonal. The ferry is winning because the city decided, a decade ago, to put transit where the new housing was going.
The more important point is that the ferry is not alone, and the modes are not moving together. Citi Bike recorded roughly 45 million trips in 2025 — more than double its 2019 volume — and posted its single best quarter on record, with two-thirds of rides now taken on e-bikes.2 That gain reflects both genuine demand and a system that has physically expanded into south and east Brooklyn, central Queens, and the northwest Bronx; it is not a pure like-for-like recovery. At the other end of the spectrum sits the subway, the workhorse that still carries the overwhelming majority of trips. It ended 2025 at about 85 percent of its 2019 ridership.3 Commuter rail lands in between: the Long Island Rail Road reached 92 percent of pre-pandemic levels and Metro-North 88 percent, both setting internal records along the way.4
The divergence is the signal. The modes tied to the rigid nine-to-five Manhattan commute — subway, suburban rail — remain meaningfully below their old peaks. The modes tied to discretionary, local, and lifestyle travel — ferry, bike, and increasingly the bus — have not merely recovered but surpassed it.
One policy lever sits underneath much of this. Congestion pricing, in effect since January 2025, cut vehicle entries into Manhattan's central business district by roughly 11 percent and pushed traffic riders onto transit: subway trips into the zone rose 9 percent and bus trips rose more. In its first year the program collected over half a billion dollars in net revenue and coincided with a 40 percent drop in traffic fatalities inside the zone.5 Pricing the road changed how the city moves.
The Cost of Staying
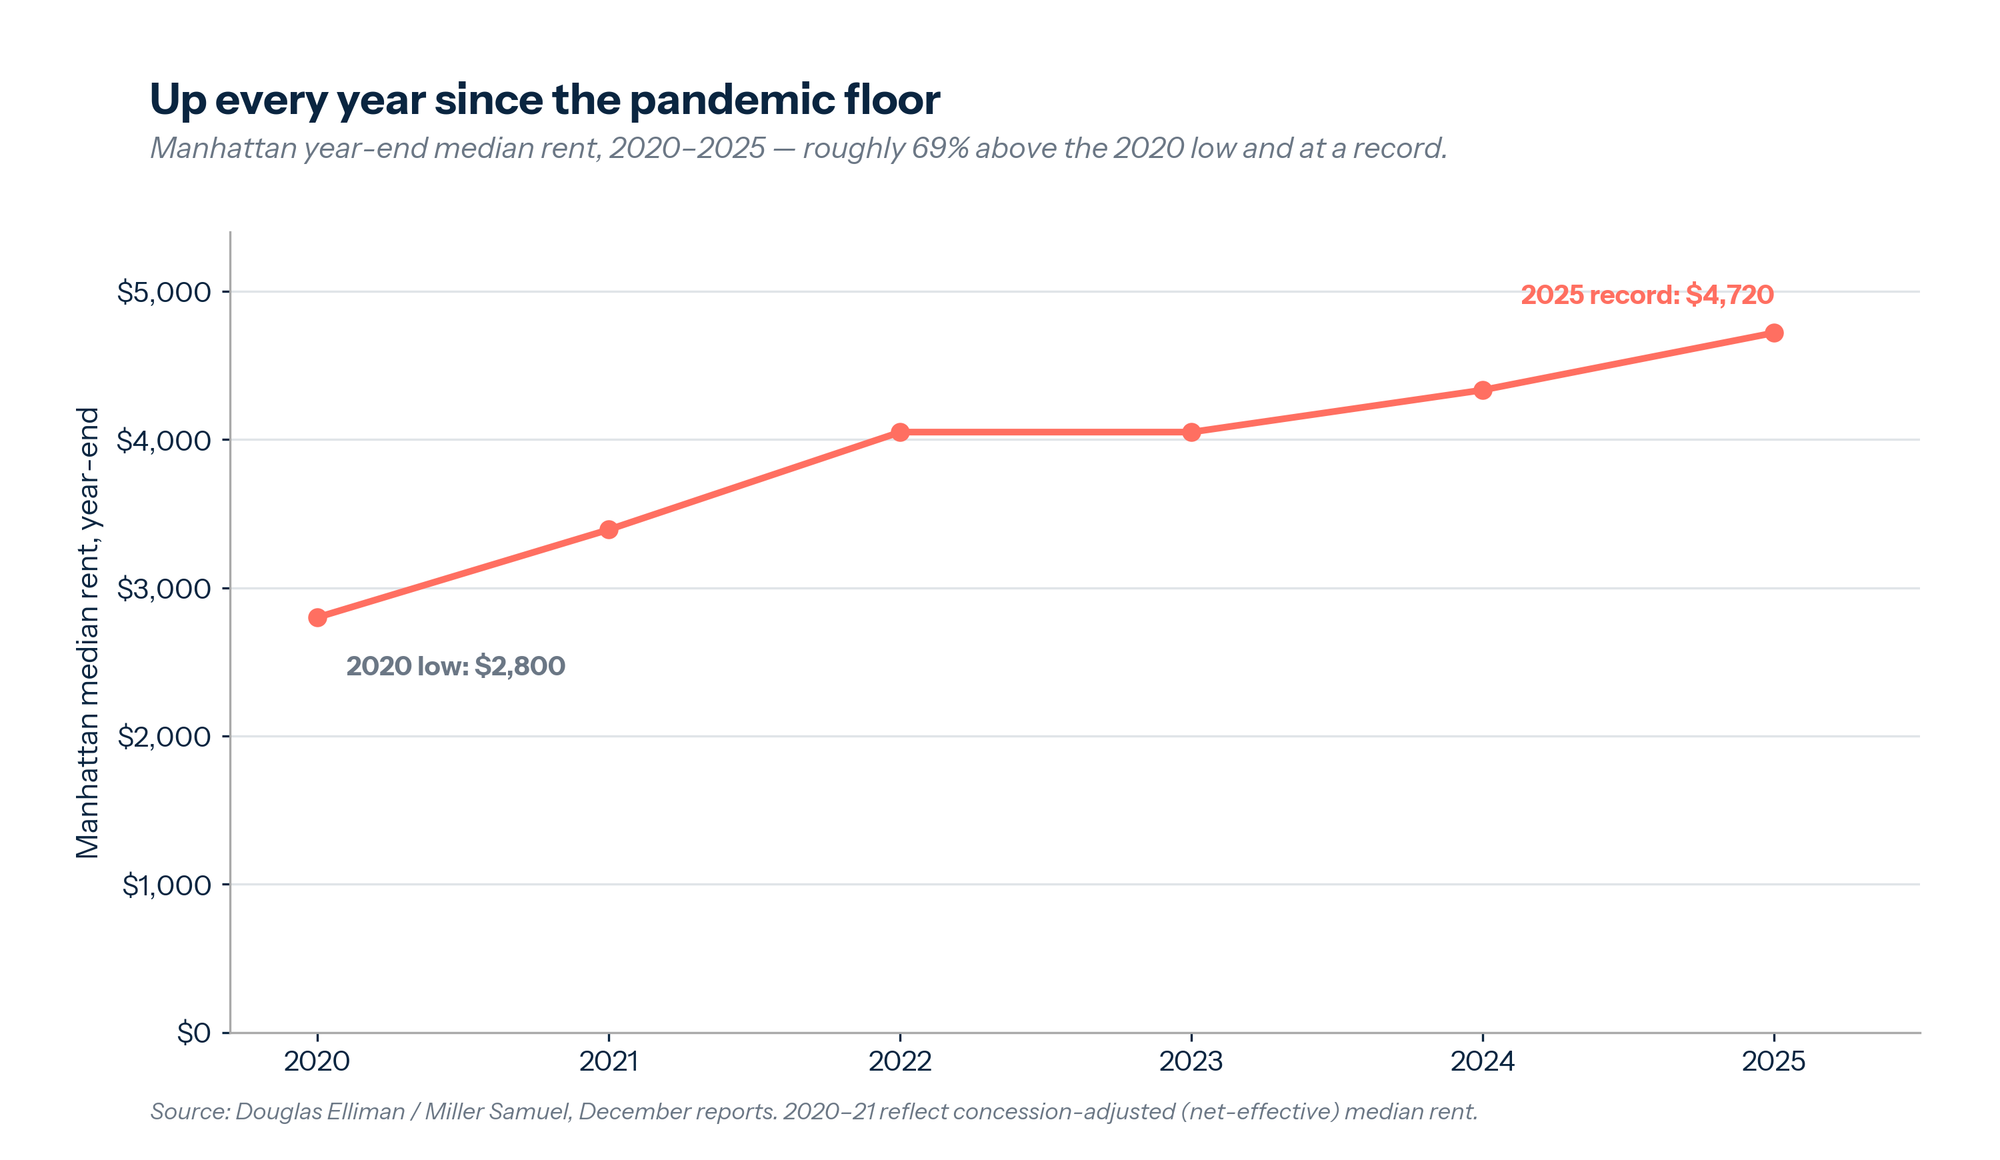
If mobility is the city's recovery, housing is its constraint — and that constraint tightens every month. From a pandemic low near $2,800 at the end of 2020, Manhattan's year-end median rent has climbed every year to a record $4,720 — and asking rents reached $5,000 in February 2026, an all-time high, while Brooklyn's hit a record $4,296.6 These are not blips. Manhattan rental inventory has now fallen for 24 consecutive months, the longest unbroken decline in the two decades StreetEasy has tracked the market. Demand is colliding with a supply that refuses to grow.
This is the affordability paradox in its purest form. Ridership records and rent records are being set in the same city, in the same quarter, by the same people. The conventional read of a high-cost city is that it eventually prices out its own vitality — that people vote with their feet and leave. New York's data says the opposite is happening, at least for now. Roughly 4.8 million jobs, tourism generating $84.7 billion in economic impact, and two years of renewed population growth before a 2025 plateau all point to a demand curve that has so far bent only slightly to price.7 People are paying the premium because they still want to be here. How long they keep paying it is the open question.
Safer Than in Generations
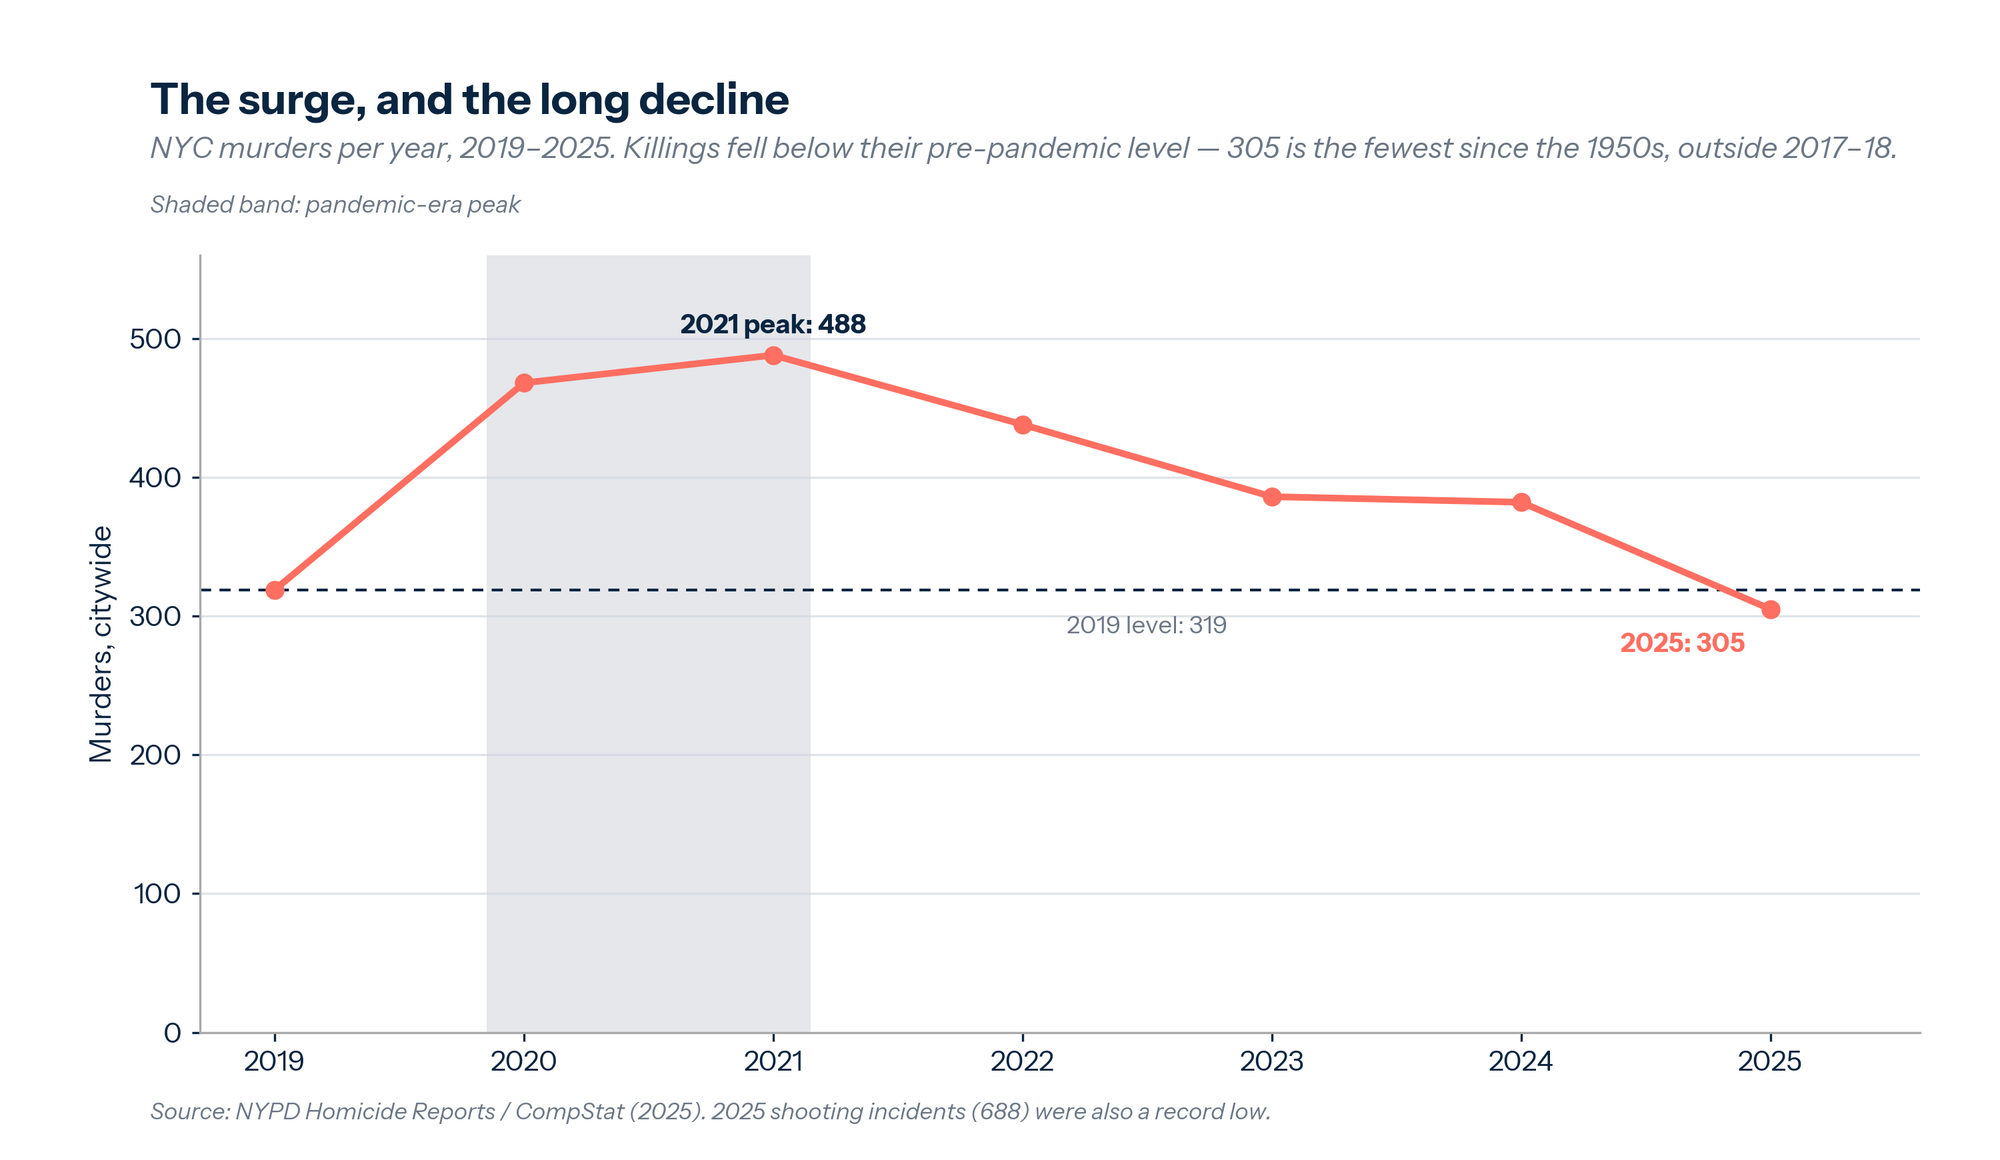
The third leg completes the physical picture, and it cuts against the city's own reputation. 2025 was the safest year for gun violence in New York's recorded history. Shooting incidents fell 24 percent to 688 — below the previous record low of 754, set in 2018. Murders tell the same story over a longer arc: after a pandemic-era surge that peaked at 488 in 2021, killings fell every year to 305 in 2025, below even the pre-pandemic level and a figure the city had not seen since the 1950s outside the record lows of 2017 and 2018.8
Safety is the quiet variable underneath the visible ones. A city that is demonstrably safer is a city in which people will ride the ferry at night, bike across boroughs, fill the restaurants, and bid up the rent. The crime decline is not a separate story from the mobility and cost stories. It is one of their causes.
The Mood and the Data Diverge
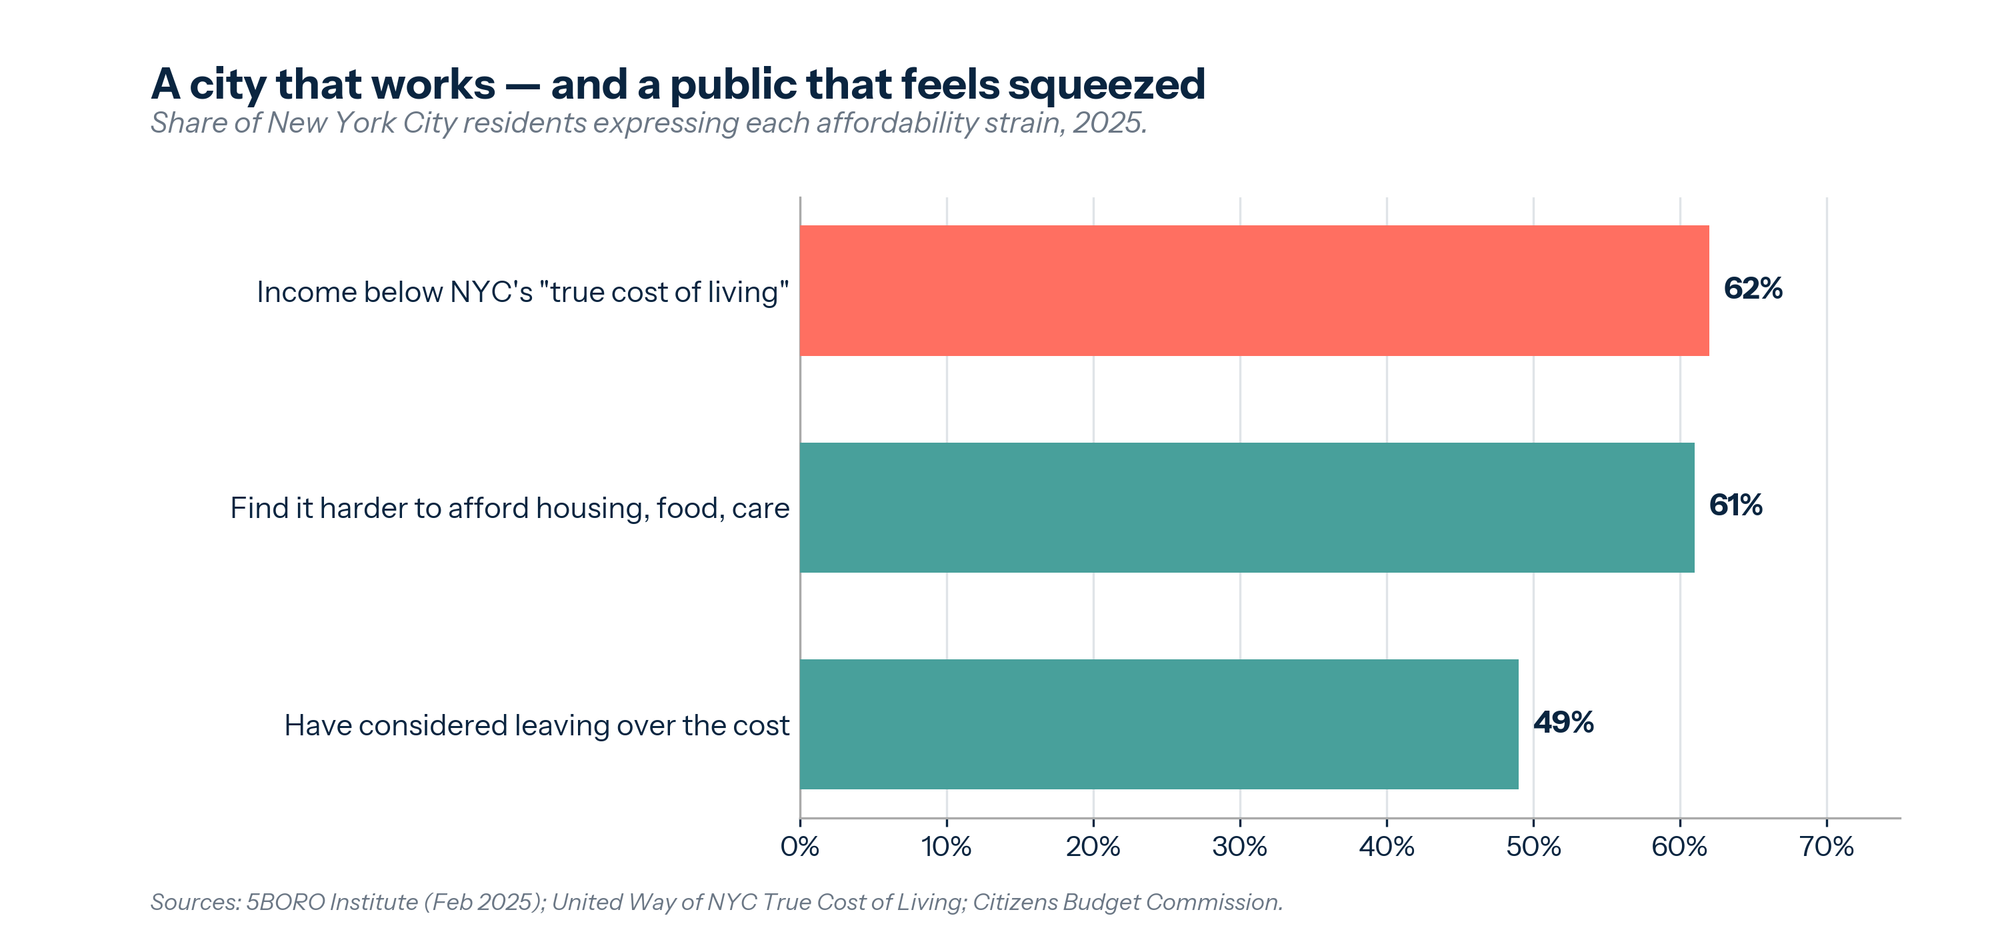
By the hard numbers, New York is winning: more motion, less violence, durable demand. Yet ask New Yorkers how it feels, and the picture inverts. A 2025 survey by the 5BORO Institute found 61 percent saying it had become harder to afford basic needs — housing, food, health care — and nearly half reporting they had considered leaving the city over the cost of living. By the city's own True Cost of Living measure, roughly 62 percent of residents earn below what it actually takes to get by here. The Citizens Budget Commission's 2025 resident survey found New Yorkers still broadly dissatisfied with quality of life and public services, and named housing affordability the single largest reason they consider leaving.9
The gap between the data and the mood is the most important fact in the city. A recovery measured in ridership and crime statistics is not a recovery people can feel when the rent consumes it. Sentiment is not lagging the data so much as tracking the one indicator still moving the wrong way — cost. New Yorkers are not confused about whether their city is safer or more vibrant. They are clear-eyed that it is also pricing them out.
The Politics of the Premium
That gap did not stay in the survey data. It elected a government. In November 2025, Zohran Mamdani — 34 years old, a democratic socialist, an immigrant from Uganda, and the first Muslim and first South Asian to hold the office — won City Hall on a single word: affordability. He campaigned on a four-year freeze on rent-stabilized leases, fare-free buses, and a "Block by Block" plan to build 200,000 affordable homes over a decade. He took the oath of office at a decommissioned subway station beneath City Hall, a piece of stagecraft that doubled as a thesis.10 His agenda is a direct read of Exhibit 2 and Exhibit 4: if the binding constraint is cost, govern the cost.
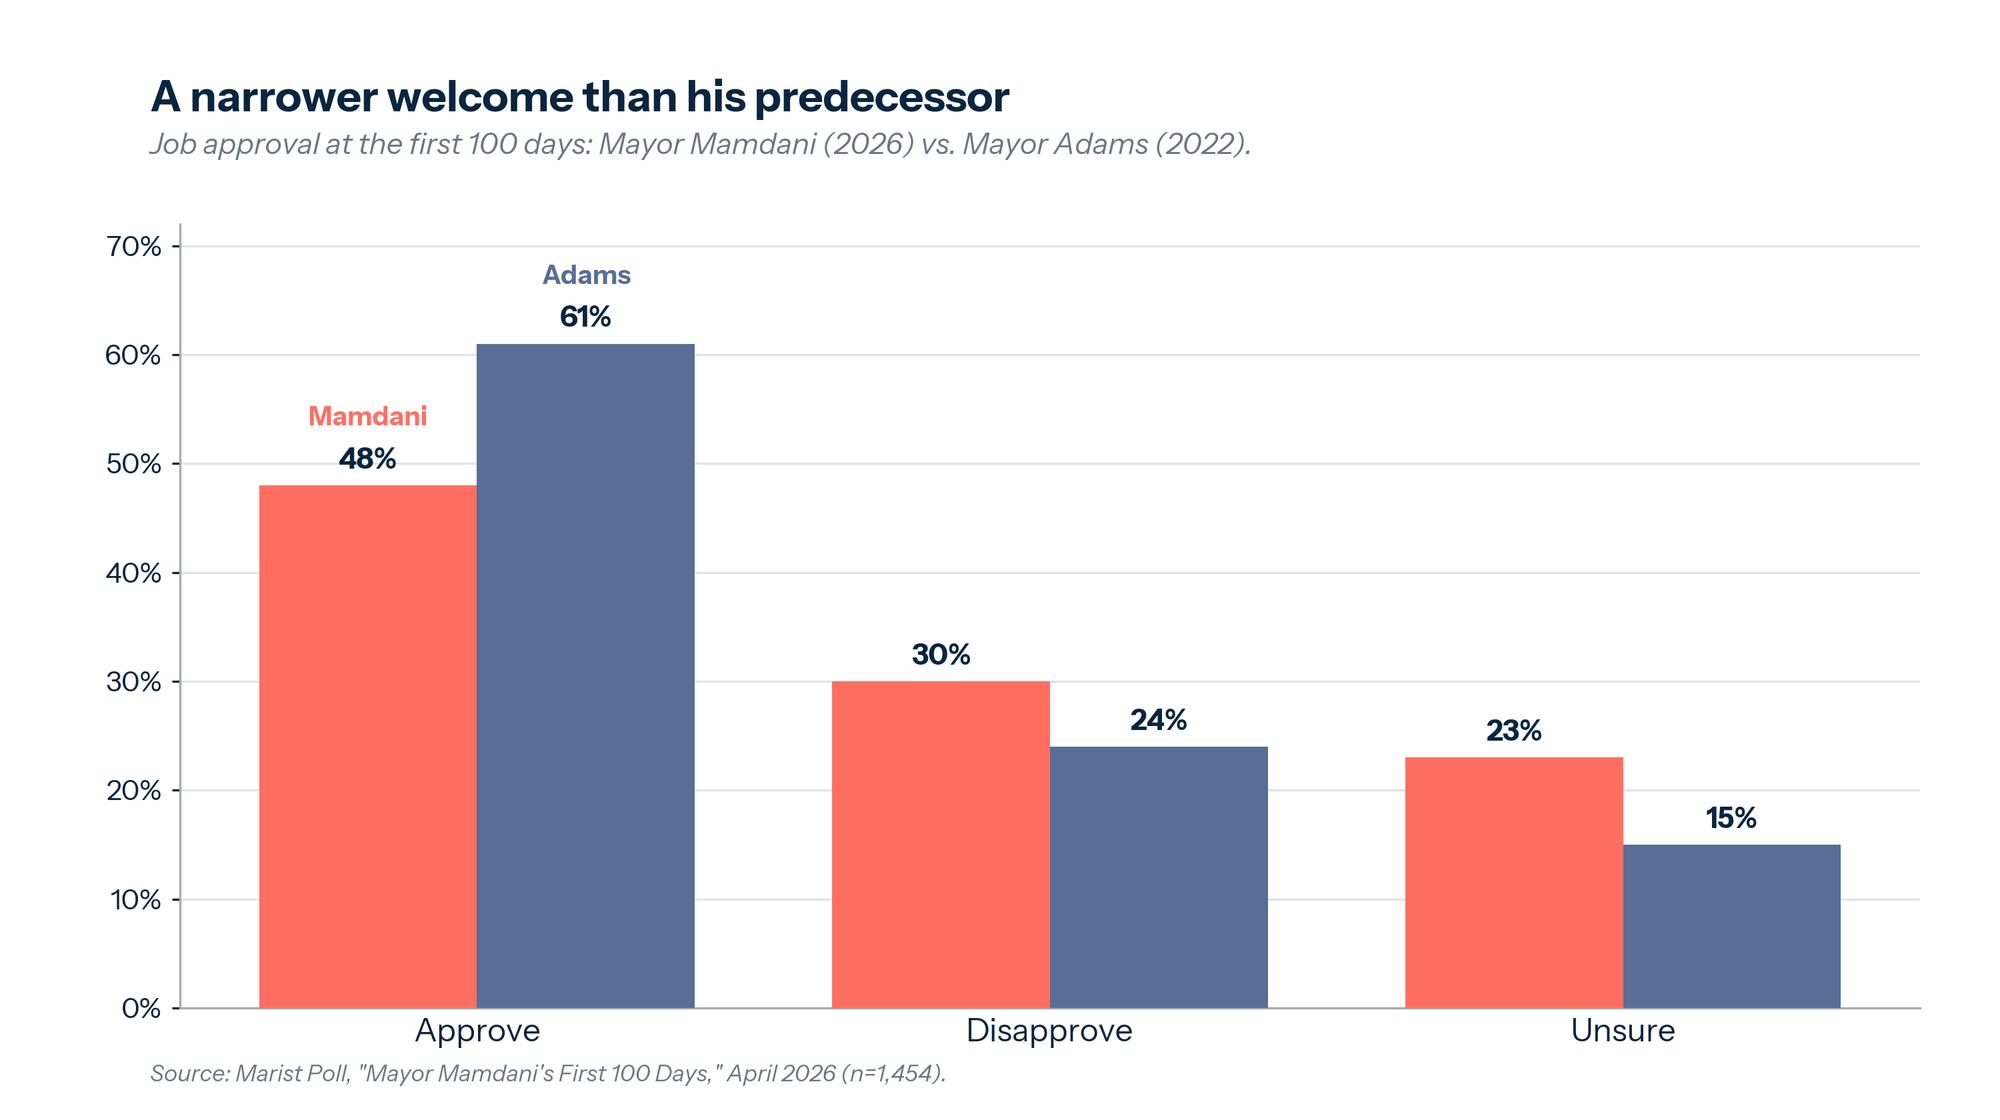
The mandate is real but not overwhelming. At his first 100 days, a Marist poll found 48 percent of residents approved of his performance and 30 percent disapproved — a net positive of 18 points, but well short of the 61 percent approval Eric Adams enjoyed at the same mark in 2022. Nearly a quarter remained unsure.11 The city did not hand Mamdani a landslide of confidence so much as a commission to try.
The agenda's mechanics are already contested. The rent freeze runs through the Rent Guidelines Board, where even a mayor-aligned majority is not guaranteed, and the administration has signaled exemptions for the most distressed small landlords. Fiscal watchdogs put the cost of fully free buses at $700 million to $1 billion a year and argue an expanded Fair Fares program would target relief more efficiently. The deeper objection is structural: most housing economists warn that a multi-year rent freeze treats the symptom and risks worsening the disease — suppressing the new construction and turnover that record rents are signaling for, and deepening the long-run shortage that drove prices up in the first place. It polls well because the relief is immediate and the costs arrive later. The politics are settled; the implementation is not.
The Exodus That Didn't Come
No constituency watched the election more warily than business. During the campaign, the city's executive class spent millions to stop Mamdani, and JPMorgan's Jamie Dimon warned that higher taxes on the wealthy and on corporations could drive an exodus of people and companies out of the city and the state. The fear was a familiar one — that a high-tax, progressive City Hall would finally tip New York into the "doom loop" commentators had forecast since 2020.
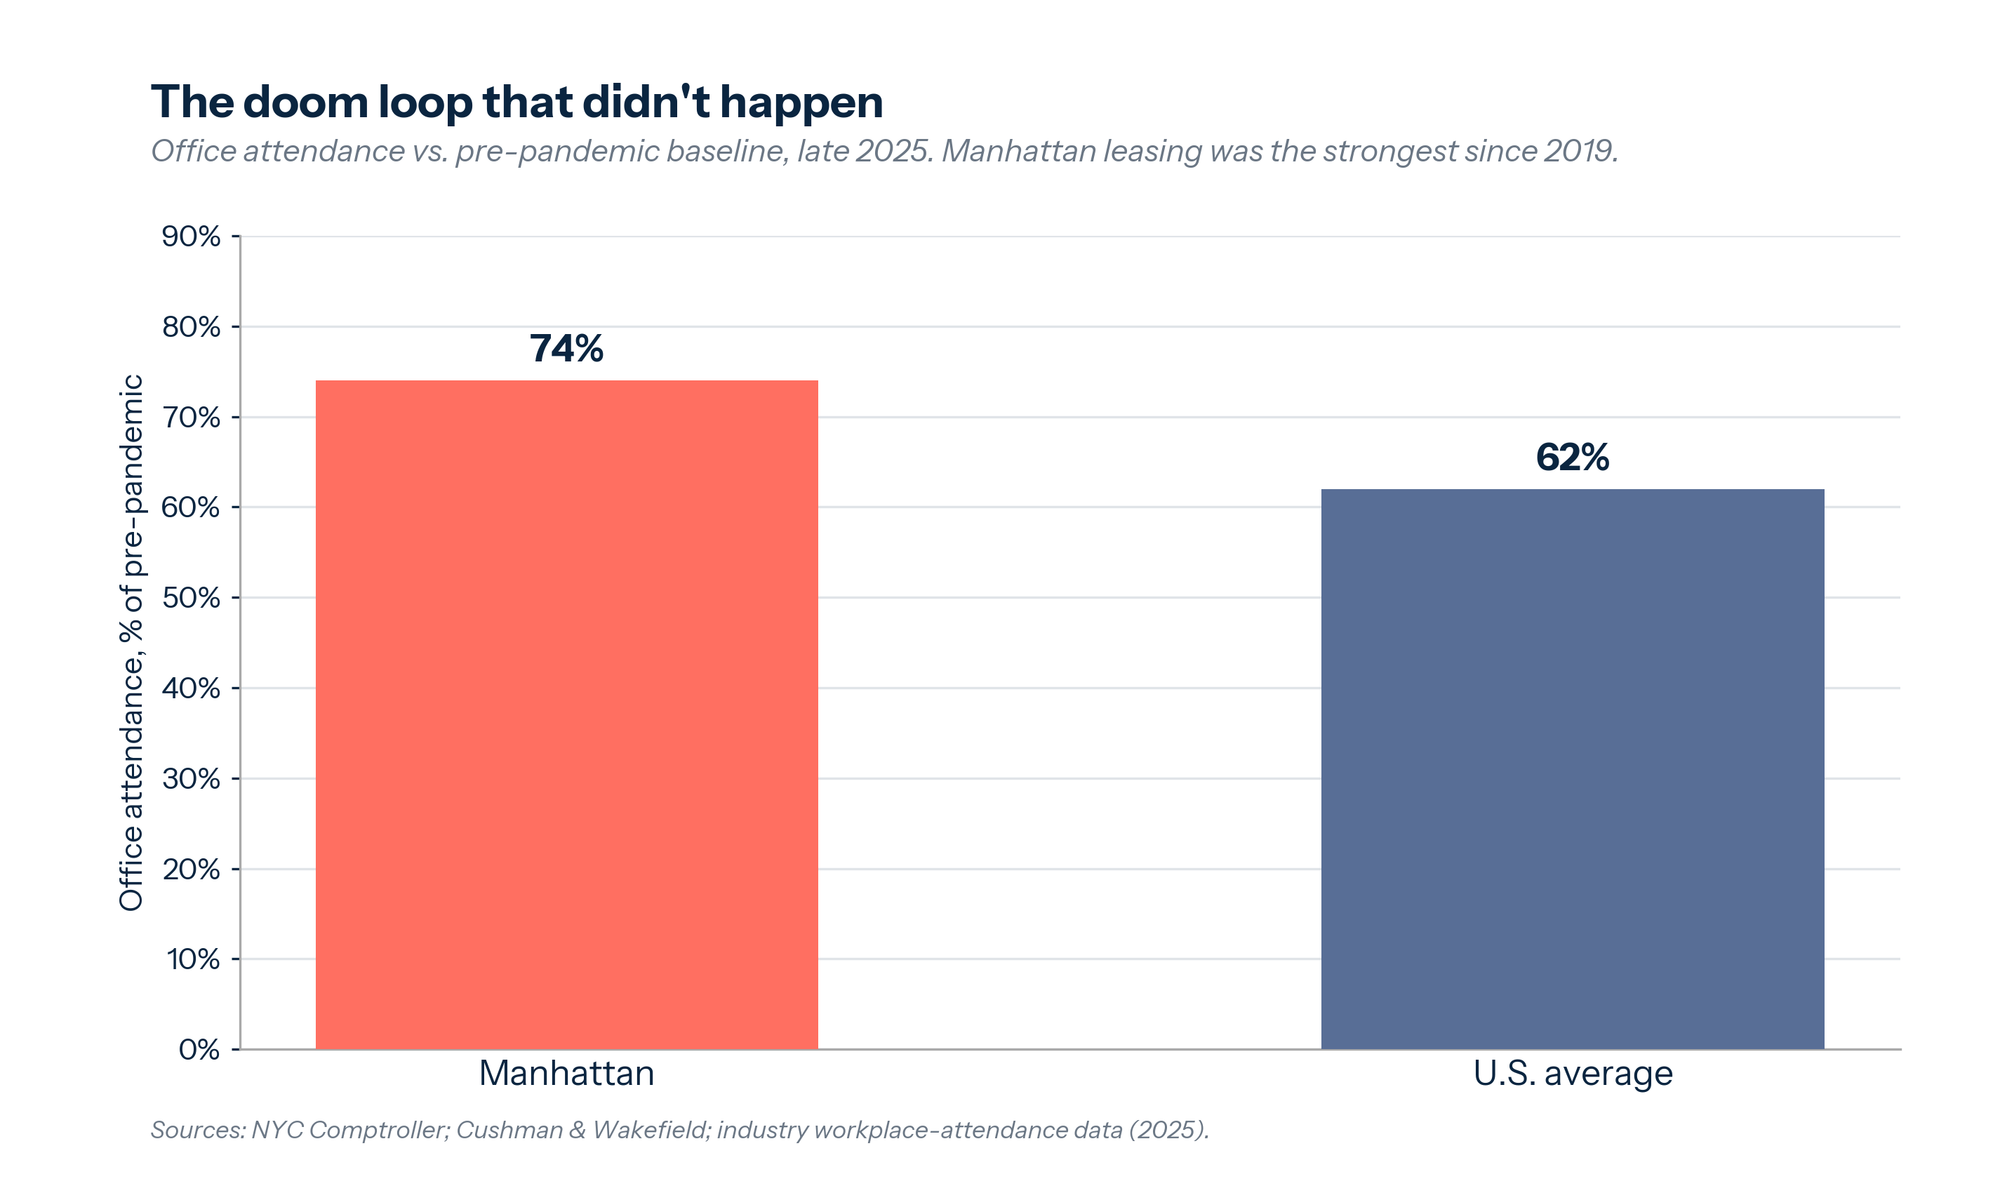
Six months in, the data does not show the exodus. Capital and headcount have largely stayed, and the clearest evidence is the office market the doom-loop thesis was built on. Manhattan leasing reached roughly 39.8 million square feet in 2025, the strongest year since 2019, with top-tier Class A leasing at a 30-year high. Office attendance recovered to about 74 percent of pre-pandemic busyness, well ahead of the U.S. metro average near 62 percent. The recovery is uneven — overall vacancy remains near 15 percent against roughly 8 percent in 2019, concentrating the gains in the best buildings — but the headline fear, that the city's economic base would flee, has not materialized. The business community's posture has shifted accordingly, from open opposition to what observers describe as a wary rapprochement with the new administration.12
The threat to leave is not nothing — tax policy can change behavior at the margin, and a handful of firms and high earners will relocate. But "the rich are staying put" is the better summary of the first half-year of evidence. Demand for New York, from residents and capital alike, has so far proven harder to dislodge than its critics assumed. The first downturn will test it.
What the Mosaic Actually Shows
Put the six tiles together and the simple "comeback" framing breaks down in a useful way. The honest read is mixed, but not muddled. The city moves more, is safer than it has been in generations, and has kept its capital and its companies — and yet a clear majority of its residents cannot comfortably afford it, and they have just installed a government with an explicit mandate to do something about it. The objective recovery and the subjective squeeze are not contradictory readings. They are the same fact seen from two ends: a city worth a great deal, priced accordingly.
The lags are worth watching. The subway and commuter rail still run below 2019, a reminder that the weekday office has not fully returned. Tourism set a strong number but fell short of its 2019 record, with international arrivals down. Population growth, robust in 2023 and 2024, flattened in 2025 as immigration normalized — and that plateau is the one figure that complicates the demand story. If cost is finally outrunning desirability, the flattening is where it would first appear. None of these signal a city in trouble. They signal a city whose central problem has changed.
For a decade, the question hanging over New York was whether it was safe and vital enough to retain people. That question has been answered, emphatically, in the data. The new question is whether it can be made affordable without dismantling the demand that makes it valuable — and whether an affordability agenda of rent freezes, free buses, and 200,000 homes closes the gap, or merely tests how inelastic that demand really is.
The ferry chart, in other words, was never really about the ferry. It was an early reading on a city that has solved the problems everyone feared and inherited a harder one in their place — not decline, but cost. Mobility is up. Crime is down. Capital has stayed. Rent is unforgiving, and it is now the organizing principle of the city's politics. New York's recovery is no longer in doubt. Its affordability is the whole game.
Notes
- NYCEDC, "Record-Breaking NYC Ferry Ridership Numbers in Summer 2025" (Sept 2025); NYC Ferry Reports & Statistics. ↩
- Lyft Urban Solutions, "All-Time Record in NYC" (2025); NYC DOT, Bike Share Usage Data Report, Q3 2025. ↩
- NYS Comptroller, "Subway Recovery Tracker" (2025–26); MTA, "Record-Breaking Year of Performance and Ridership for the MTA in 2025." ↩
- MTA, "Record Breaking Ridership on Metro-North and the Long Island Rail Road" (Dec 2025). ↩
- Office of Governor Kathy Hochul, "On Its First Anniversary, Governor Hochul Celebrates Transformational Success of Congestion Pricing" (Jan 2026). ↩
- The Corcoran Group and StreetEasy rental reports (Feb 2026); Douglas Elliman / Miller Samuel December reports (2020–2025). ↩
- NYC Department of City Planning, "New York City's Population Estimates and Trends" (Mar 2026); NYC Tourism + Conventions, "2025 Visitation Surpasses Forecast" (Mar 2026). ↩
- NYPD Homicide Reports and CompStat (2025); Brennan Center for Justice, "2025 Trends in Crime and Safety in New York City." ↩
- 5BORO Institute resident survey (Feb 2025); United Way of New York City, True Cost of Living measure; Citizens Budget Commission, "Straight from New Yorkers 2025." ↩
- CNN, NPR, and THE CITY coverage of the Mamdani inauguration (Jan 1, 2026); NYC Mayor's Office, "Block by Block" housing agenda (2026). ↩
- Marist Poll, "Mayor Mamdani's First 100 Days" (April 2026, n=1,454). ↩
- THE CITY, "The Business Freakout Over Mamdani Peters Out, Mostly" (2025); JPMorgan Chase shareholder letter (2026); Cushman & Wakefield Manhattan office reports (2025); Office of the NYC Comptroller, "NYC's Office Market: Doom Loop or Boom Loop?" (2025). ↩