The Price That Prices the World
Brent crude has risen roughly 70 percent since February
A short intelligence memo on State Capacity. Read for the core judgment, evidence trail, and decision implication.
Brent crude has risen roughly 70 percent since February
- Frame
- Briefing
- Topic
- State Capacity
- Access
- Free
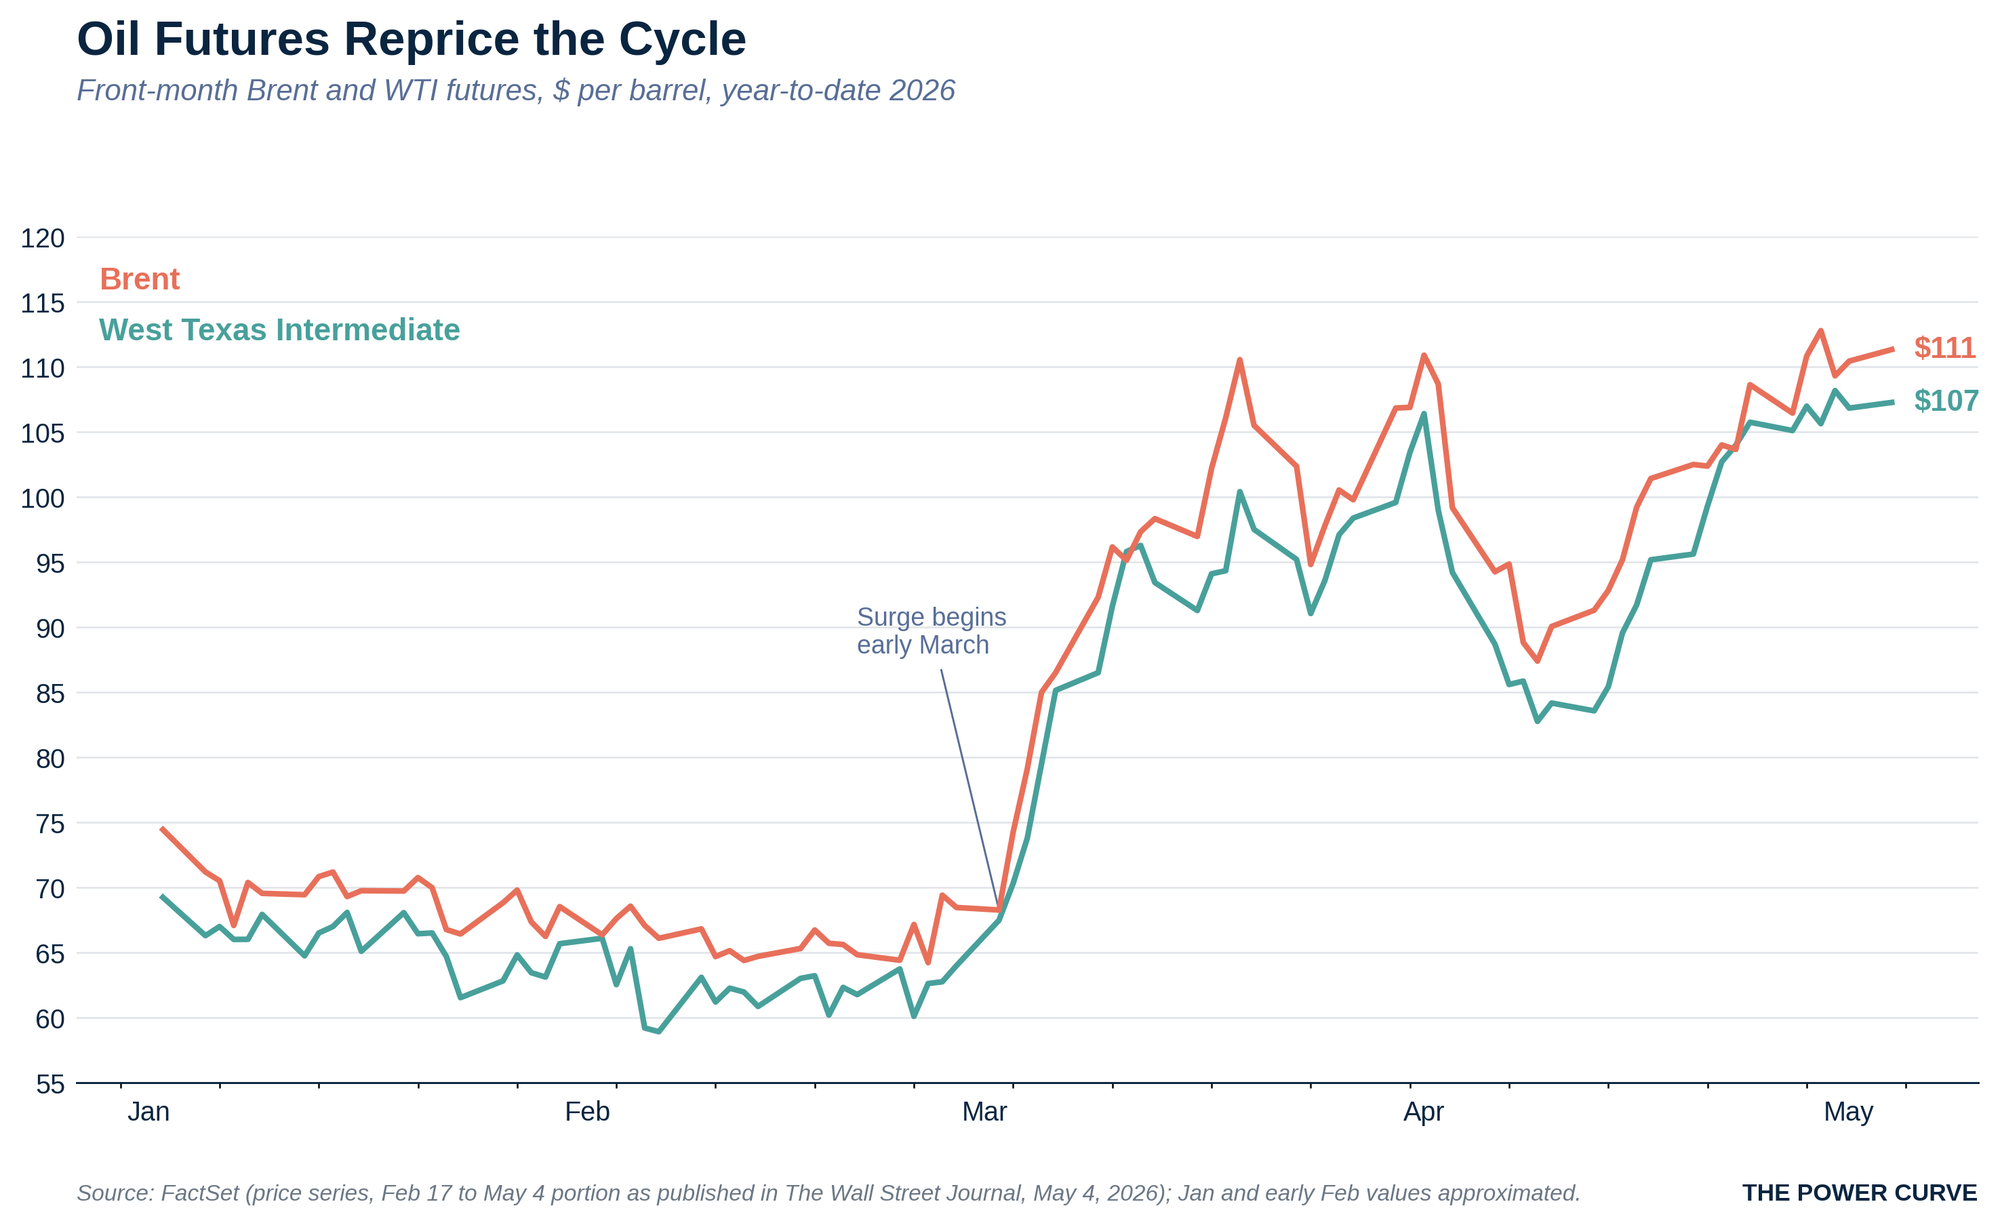
Brent crude is the benchmark price for roughly two-thirds of internationally traded oil.1 The contract is built on a thinning basket of North Sea fields, supplemented since 2023 by one Texas grade added to keep it liquid.2 Its surge from the mid-$60s in late February to roughly $110 today carries through to inflation, central-bank policy, sovereign budgets, and equity markets simultaneously. Each $10 sustained increase trims roughly 0.1 to 0.2 percentage points from global growth and adds two to four tenths of a point to advanced-economy headline inflation.3
The Basket
Brent began as a single oilfield. Discovered by Shell in 1971 and named, in keeping with the company's tradition of naming North Sea fields after seabirds, for the Brent goose, the field began producing in 1976 and quickly became the reference point for European crude trading. As output from the original field declined toward exhaustion, the benchmark expanded into a basket. The current contract is built on five North Sea grades. Brent, Forties, Oseberg, Ekofisk, and Troll, often called BFOET, are produced in fields shared between the United Kingdom and Norway.
The grade itself is light and sweet. Light means a high API gravity, a standard measure of density relative to water; Brent runs about 38 degrees, well above the threshold for a light crude. Sweet means low sulfur content, roughly 0.37 percent, well under the half-percent line that separates sweet from sour. Light, sweet crude is easier and cheaper to refine into high-value products such as gasoline, diesel, and jet fuel than the heavier, sourer grades produced in much of the Middle East and parts of the Americas. That refining advantage is why a small volume of North Sea oil came, decades ago, to set the price for crude shipped from places that produce twenty times as much.
The volume problem eventually became acute. North Sea production has fallen by more than two-thirds from its 1999 peak,4 and the BFOET basket together now produces under a million barrels a day in a global market of more than 100 million. To keep the benchmark liquid enough to remain honest, in 2023 S&P Global Commodity Insights, formerly Platts, the firm that assesses the price daily, added WTI Midland, a U.S. grade pumped from the Permian Basin and exported from the Gulf Coast, to the deliverable basket.5 Brent now prices any light, sweet crude that can be loaded onto a tanker.
Priced at Sea
Two prices matter. The first is Dated Brent, the spot benchmark assessed each day by S&P Global Commodity Insights based on physical cargoes loading in the North Sea, and now the U.S. Gulf, ten to thirty days forward. The second is ICE Brent futures, traded on the Intercontinental Exchange in London, which is the most heavily traded oil contract in the world and the screen price most commonly cited in news reports, including the chart on the front of The Wall Street Journal this week.
Brent's seaborne character is the key to its dominance. Its main rival, West Texas Intermediate (WTI), is delivered at Cushing, Oklahoma, an inland storage hub. WTI is therefore captive to U.S. logistics in a way Brent is not. When the Cushing pipeline network bottlenecks, WTI dislocates from the rest of the world; in the spring of 2020 it briefly traded below zero. Brent, loaded onto tankers, travels with the global market. A benchmark that can move with the cargo is a better benchmark for a global market.
The Universal Repricer
Brent transmits through every major asset class. Headline inflation in the United States and Europe moves with energy prices in close to real time, which means Brent helps determine when the Federal Reserve and European Central Bank cut or hold. Equity markets reprice in two directions at once. Integrated oil majors and oilfield-services firms benefit, while airlines, transport companies, petrochemical producers, and consumer-discretionary names absorb a margin hit. Sovereign credit shifts: oil exporters from Saudi Arabia to Nigeria see fiscal break-evens improve, while net importers from India to Turkey see current accounts deteriorate and currencies come under pressure. The price also encodes geopolitical risk in close to real time. Every meaningful escalation in the Persian Gulf, every disruption to Russian seaborne flows, and every OPEC+ communiqué shows up in Brent before it shows up anywhere else.
A chart of Brent prices is, in a meaningful sense, a chart of how the global economy is being repriced from one week to the next.
The Arithmetic of $45
The empirical work is reasonably stable. Studies from the International Monetary Fund, the Organisation for Economic Co-operation and Development, and the Federal Reserve converge on a working rule of thumb: a sustained $10 per barrel increase in oil prices reduces global GDP by roughly 0.1 to 0.2 percentage points after one to two years and raises headline inflation in advanced economies by 0.2 to 0.4 percentage points.6 The drag is larger in oil-importing emerging markets, where energy is a higher share of household consumption and where the pass-through to retail fuel prices is more direct. In the United States, the rough conversion is that every $10 move in Brent translates to about 25 cents at the pump.
The current move is therefore material. Brent has risen from roughly $65 to $110 in about two months, a $45 move and close to 70 percent.7 Applying the standard elasticities, a sustained increase of that magnitude would translate to something on the order of half a percentage point off global growth and one to two percentage points added to advanced-economy headline inflation over the next year. That is enough to delay rate cuts, restart the inflation conversation that central bankers had begun to declare won, and reset the equity rotation that has dominated 2026 so far.
What to Watch
Five variables will determine the path from here. The first is the next OPEC+ output decision: a coordinated release of spare capacity would cap the rally, while a further cut would extend it. The second is the U.S. shale response. Permian rig counts and capital-expenditure guidance from the majors are the leading indicators of whether American supply absorbs the price signal within months or only over years. The third is the Persian Gulf and Russian seaborne flow picture, where the futures curve is already pricing a meaningful disruption premium that can compress quickly if tensions ease. The fourth is refinery crack spreads, the gap between crude and refined product prices; widening cracks would signal that the surge has further to run through to consumer fuel costs. The fifth is central-bank language. Whether the Federal Reserve and European Central Bank treat the move as a transient supply shock or as a renewed inflation impulse will shape the policy path more than the price itself.
Brent is the closest thing the global economy has to a universal price. It is set by a thinning basket of North Sea fields, supplemented now by Texas crude, and it travels by tanker to every refining hub in the world. When it moves $45 in two months, it moves the world with it. The current run-up should be treated as a macroeconomic event. Brent at $110 has reset the inflation arithmetic for 2026. Investors and policymakers should price the consequences accordingly.
Notes
- S&P Global Commodity Insights, Platts Dated Brent Methodology and Specifications Guide, current edition. ↩
- S&P Global Commodity Insights, "Inclusion of WTI Midland in the Dated Brent Benchmark," methodology change effective June 2023. ↩
- International Monetary Fund, World Economic Outlook (analytical chapters on oil-price shocks); OECD, Economic Outlook (oil-price scenario analysis); Federal Reserve Board working papers on oil-price pass-through to U.S. inflation and activity. ↩
- UK North Sea Transition Authority and Norwegian Offshore Directorate, production statistics. ↩
- S&P Global Commodity Insights, "Inclusion of WTI Midland in the Dated Brent Benchmark," methodology change effective June 2023. ↩
- International Monetary Fund, World Economic Outlook (analytical chapters on oil-price shocks); OECD, Economic Outlook (oil-price scenario analysis); Federal Reserve Board working papers on oil-price pass-through to U.S. inflation and activity. ↩
- FactSet, oil futures price series, February to May 2026; chart published in The Wall Street Journal, May 4, 2026. ↩