

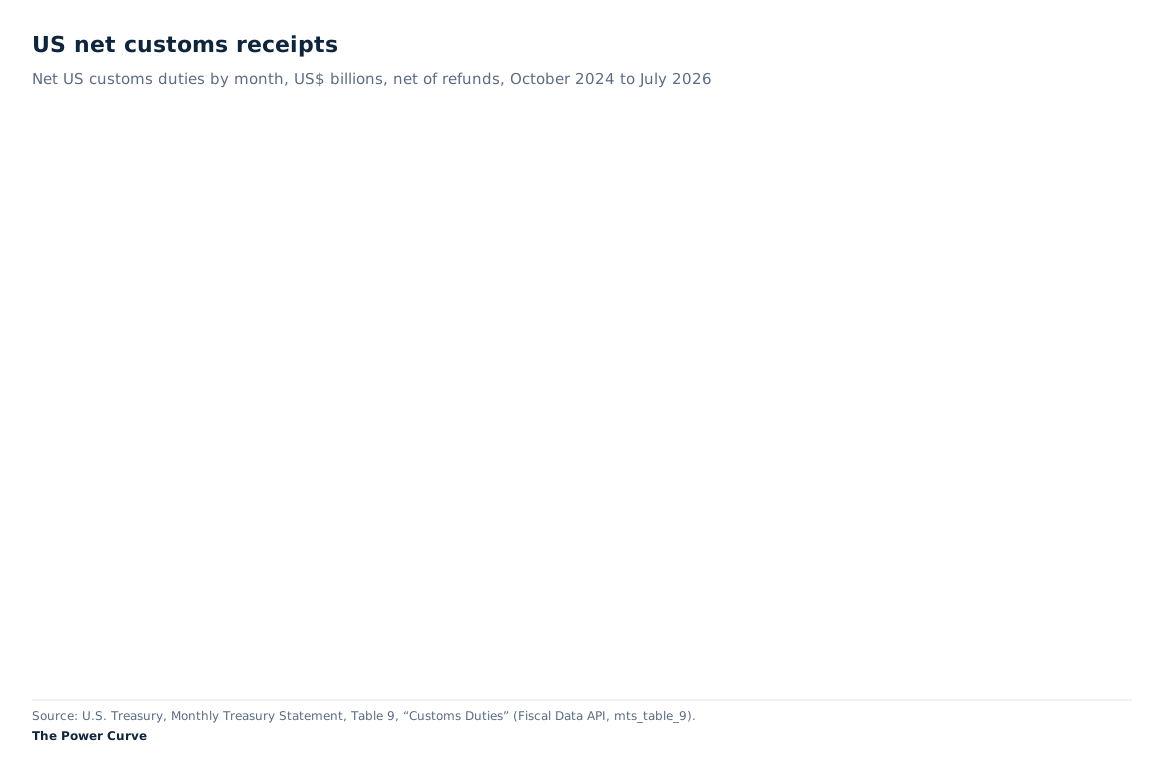
The United States Treasury recorded negative net customs receipts in May, June, and July 2026. June’s outflow reached $25.6 billion eight months after monthly collections peaked at $31.4 billion. The Supreme Court’s rejection of the Trump administration’s emergency tariff authority started to show up in the global trade ledger.1 2
This economic story starts but does not end with tariffs. While the Trump administration was unveiling its tariff regime, China’s global surplus increased while the U.S. deficit with China decreased. Core goods inflation slowed even as headline inflation rose. The aggregate U.S. trade deficit narrowed before widening again in July as computing-equipment imports increased.
These are different dimensions of the same tariff experiment. The six exhibits below show how they fit together: the government’s receipts, China’s external balance, the geography of U.S. imports, consumer prices, the overall trade balance and the demand for capital goods. Each answers a distinct question about what changed.
Relief Through Legal Intervention
On February 20, the Supreme Court held, six to three, that the International Emergency Economic Powers Act did not authorize the president to impose tariffs. The ruling concerned IEEPA duties, including the reciprocal and fentanyl tariffs. Duties imposed under other statutes had separate legal foundations.2
Table 1: Tariff authorities and their constraints
| Authority | Purpose | Constraint relevant to the unwind |
|---|---|---|
| IEEPA | Emergency economic powers | Supreme Court held that it confers no tariff authority |
| Section 122 | International payments problems | Temporary surcharge; the February proclamation specified a July 24 endpoint |
| Section 301 | Unfair foreign trade practices | Statutory findings and procedures tied to the challenged practices |
| Section 232 | National security | Statutory investigation and findings concerning imports |
Sources: Supreme Court opinion and presidential proclamation. This is a comparison of authorities, not a complete schedule of current tariff rates.2 3
The administration’s February response imposed a 10 percent surcharge under Section 122, with exceptions. In May, the Court of International Trade separately ruled that Section 122 was unlawful and granted relief to specified plaintiffs. It turns out that replacing IEEPA requires more than changing the name of the authority.3
Revenue Reversal
Exhibit 1 traces the rise and fall. Net monthly customs receipts rose from about $7 billion in late 2024 to $31.4 billion in October 2025. They remained elevated through April 2026 before falling below zero for three consecutive months.1
Exhibit 1: US net customs receipts
Net US customs duties by month, US$ billions, net of refunds, October 2024 to July 2026
Exhibit 1: Net U.S. customs receipts, October 2024–July 2026. Receipts peaked at $31.4 billion in October 2025 and turned negative in May, June and July 2026. June’s net outflow was $25.6 billion.
View data
| Month | Net receipts, US$ bn | Fiscal YTD, US$ bn |
|---|---|---|
| Oct 2024 | 7.3 | 7.3 |
| Nov 2024 | 6.7 | 14.0 |
| Dec 2024 | 6.8 | 20.8 |
| Jan 2025 | 7.3 | 28.2 |
| Feb 2025 | 7.3 | 35.4 |
| Mar 2025 | 8.2 | 43.6 |
| Apr 2025 | 15.6 | 59.2 |
| May 2025 | 22.2 | 81.4 |
| Jun 2025 | 26.6 | 108.0 |
| Jul 2025 | 27.7 | 135.7 |
| Aug 2025 | 29.5 | 165.2 |
| Sep 2025 | 29.7 | 194.9 |
| Oct 2025 | 31.4 | 31.4 |
| Nov 2025 | 30.8 | 62.1 |
| Dec 2025 | 27.9 | 90.0 |
| Jan 2026 | 27.7 | 117.7 |
| Feb 2026 | 26.6 | 144.3 |
| Mar 2026 | 22.1 | 166.5 |
| Apr 2026 | 22.1 | 188.6 |
| May 2026 | -0.0 | 188.6 |
| Jun 2026 | -25.6 | 163.0 |
| Jul 2026 | -8.6 | 154.5 |
| Aug 2026 | 12.8 | 167.3 |
Source: U.S. Treasury, Monthly Treasury Statement, Table 9, “Customs Duties” (Fiscal Data API, mts_table_9). Notes: Current-month net receipts, net of refunds. Fiscal year runs October to September.
Source: U.S. Treasury, Monthly Treasury Statement, Table 9, “Customs Duties” (Fiscal Data API, mts_table_9).
The fiscal-year total fell from $188.6 billion in April to $154.5 billion in July, a $34.1 billion reduction, although it remained positive and above the prior-year comparison.
The process of repayment has its own timeline. By August 2026, CBP had accepted $132.5 billion in potential and certified refunds through its CAPE system, certifying $106.6 billion in duties and interest that it sent to the Treasury for disbursement. Certification precedes payment; the declaration does not identify the entire sum as cash already received by importers.4
Growing Chinese Surplus
The global balance tells a different story. China’s annual goods surplus rose from about $823 billion in 2023 to $992 billion in 2024 and $1.189 trillion in 2025. Exhibit 2 compares full-year customs figures on the same basis.5 6
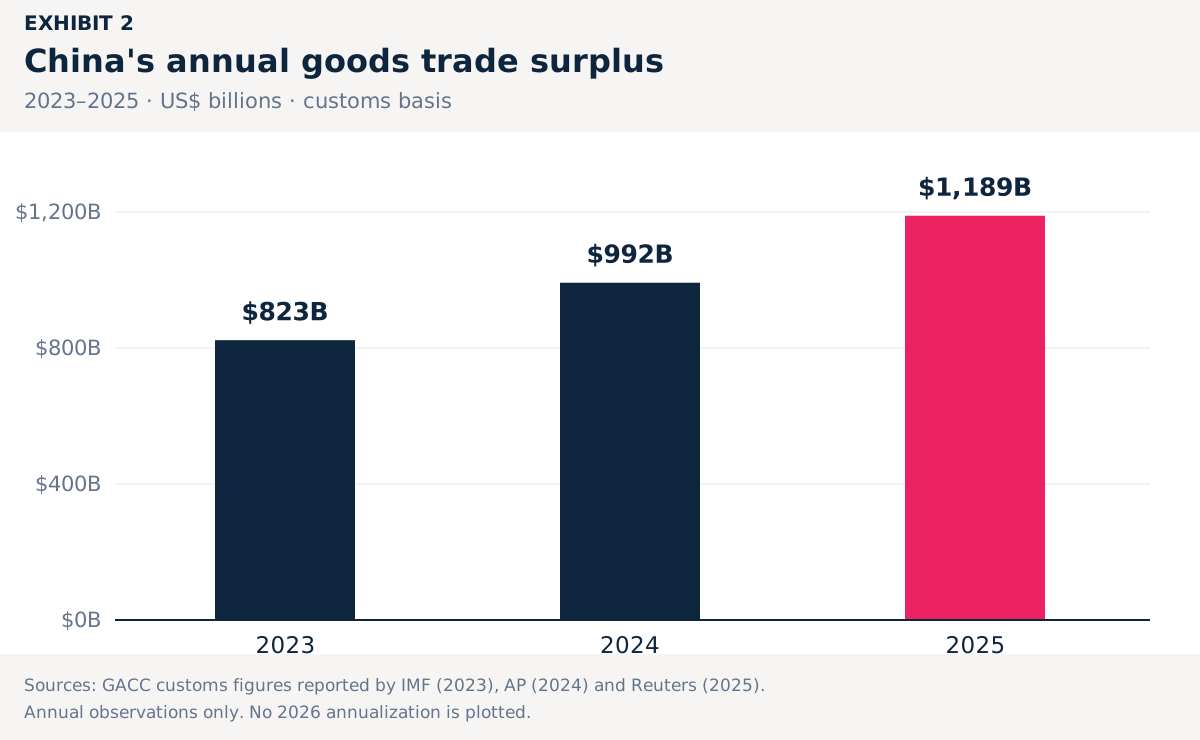
The increase matters because restricting one export destination, even one as powerful as the United States, does not necessarily reduce a country’s surplus with the world. Producers can find other buyers, especially when weak domestic demand restrains imports. The IMF linked China’s low inflation to real exchange-rate depreciation, stronger exports, and wider external imbalances.7
The chart shows that, as the Trump administration escalated, China’s surplus expanded. Measuring how much tariffs restrained that expansion would require a comparison with the path exports and imports would otherwise have taken. Nevertheless, the bilateral tariff confrontation did not stem a larger Chinese global surplus.
Shifting Geographies
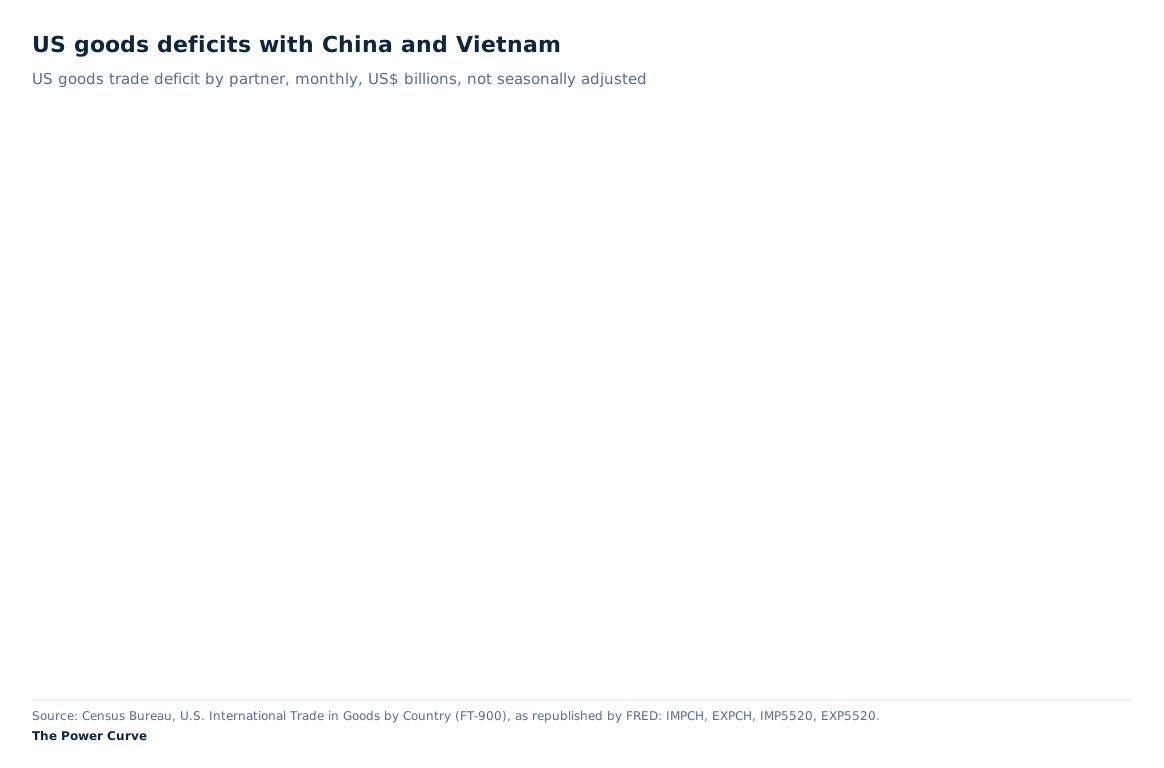
Exhibit 3 moves from China’s worldwide balance to the United States’ balances with individual suppliers. The U.S. goods deficit with China fell from $297.0 billion in 2024 to $202.7 billion in 2025 while the deficit with Vietnam widened from $123.2 billion to $178.3 billion.8
Exhibit 3: US goods deficits with China and Vietnam
US goods trade deficit by partner, monthly, US$ billions, not seasonally adjusted
Exhibit 3: U.S. goods deficits with China and Vietnam, 2024–2025. The China deficit fell 31.8 percent while the Vietnam deficit rose 44.6 percent, calculated from unrounded Census data.
View data
| Month | China deficit, US$ bn | Vietnam deficit, US$ bn | China imports | China exports | Vietnam imports | Vietnam exports |
|---|---|---|---|---|---|---|
| Jan 2024 | 23.7 | 8.7 | 35.8 | 12.1 | 9.5 | 0.8 |
| Feb 2024 | 19.8 | 8.7 | 31.9 | 12.1 | 9.5 | 0.9 |
| Mar 2024 | 17.3 | 9.0 | 29.9 | 12.6 | 10.0 | 1.0 |
| Apr 2024 | 20.1 | 9.3 | 31.6 | 11.6 | 10.1 | 0.8 |
| May 2024 | 23.7 | 10.5 | 35.0 | 11.3 | 11.4 | 0.9 |
| Jun 2024 | 22.9 | 10.4 | 34.2 | 11.3 | 11.4 | 1.0 |
| Jul 2024 | 30.1 | 10.0 | 40.9 | 10.8 | 11.9 | 1.9 |
| Aug 2024 | 28.0 | 10.9 | 40.0 | 12.0 | 11.8 | 0.9 |
| Sep 2024 | 32.0 | 12.9 | 43.2 | 11.1 | 13.9 | 1.0 |
| Oct 2024 | 28.6 | 11.6 | 42.0 | 13.4 | 12.8 | 1.2 |
| Nov 2024 | 25.5 | 10.9 | 38.1 | 12.6 | 12.1 | 1.2 |
| Dec 2024 | 25.4 | 10.4 | 37.8 | 12.3 | 11.7 | 1.4 |
| Jan 2025 | 31.9 | 12.0 | 41.8 | 9.9 | 13.0 | 0.9 |
| Feb 2025 | 21.2 | 10.9 | 31.7 | 10.4 | 11.9 | 1.0 |
| Mar 2025 | 18.0 | 13.6 | 29.5 | 11.5 | 14.8 | 1.2 |
| Apr 2025 | 17.2 | 13.6 | 25.3 | 8.1 | 14.8 | 1.3 |
| May 2025 | 13.9 | 14.7 | 20.4 | 6.5 | 16.0 | 1.3 |
| Jun 2025 | 9.4 | 16.6 | 18.9 | 9.5 | 17.8 | 1.2 |
| Jul 2025 | 17.1 | 16.6 | 26.4 | 9.3 | 18.0 | 1.3 |
| Aug 2025 | 17.1 | 15.0 | 25.4 | 8.3 | 16.4 | 1.4 |
| Sep 2025 | 15.2 | 16.7 | 23.5 | 8.4 | 17.8 | 1.1 |
| Oct 2025 | 15.1 | 16.2 | 24.0 | 8.9 | 17.8 | 1.5 |
| Nov 2025 | 13.7 | 15.4 | 20.6 | 7.0 | 17.0 | 1.7 |
| Dec 2025 | 12.8 | 16.9 | 21.1 | 8.3 | 18.5 | 1.6 |
| Jan 2026 | 12.7 | 18.3 | 21.1 | 8.3 | 19.6 | 1.3 |
| Feb 2026 | 11.0 | 14.4 | 19.0 | 7.9 | 15.7 | 1.3 |
| Mar 2026 | 9.8 | 19.0 | 20.9 | 11.1 | 20.5 | 1.6 |
| Apr 2026 | 10.4 | 18.4 | 19.8 | 9.4 | 20.4 | 2.0 |
| May 2026 | 14.4 | 20.3 | 23.5 | 9.1 | 21.8 | 1.4 |
| Jun 2026 | 15.6 | 23.6 | 25.1 | 9.6 | 25.2 | 1.5 |
| Jul 2026 | 17.4 | 24.8 | 27.1 | 9.7 | 26.4 | 1.6 |
Source: Census Bureau, U.S. International Trade in Goods by Country (FT-900), as republished by FRED: IMPCH, EXPCH, IMP5520, EXP5520. Notes: Deficit is general imports (customs basis) less total exports (f.a.s.), not seasonally adjusted. Annual figures in the essay are the sums of these months.
Source: Census Bureau, U.S. International Trade in Goods by Country (FT-900), as republished by FRED: IMPCH, EXPCH, IMP5520, EXP5520.
Vietnam’s $55.0 billion increase offset about 58 percent of the $94.4 billion narrowing with China. This coupling indicates a shift in sourcing, but it does not distinguish between new Vietnamese production, assembly using Chinese inputs, and transshipment. The pattern continued into 2026. U.S. imports from Vietnam reached $149.6 billion through July, compared with $156.4 billion from China.
The practical question is how much production moved; how many Chinese components remained embedded in other countries’ exports; and how those changes affected costs. Bilateral totals reveal the changing geography, but they do not resolve the supply chain powering it.8
Diverging Inflation
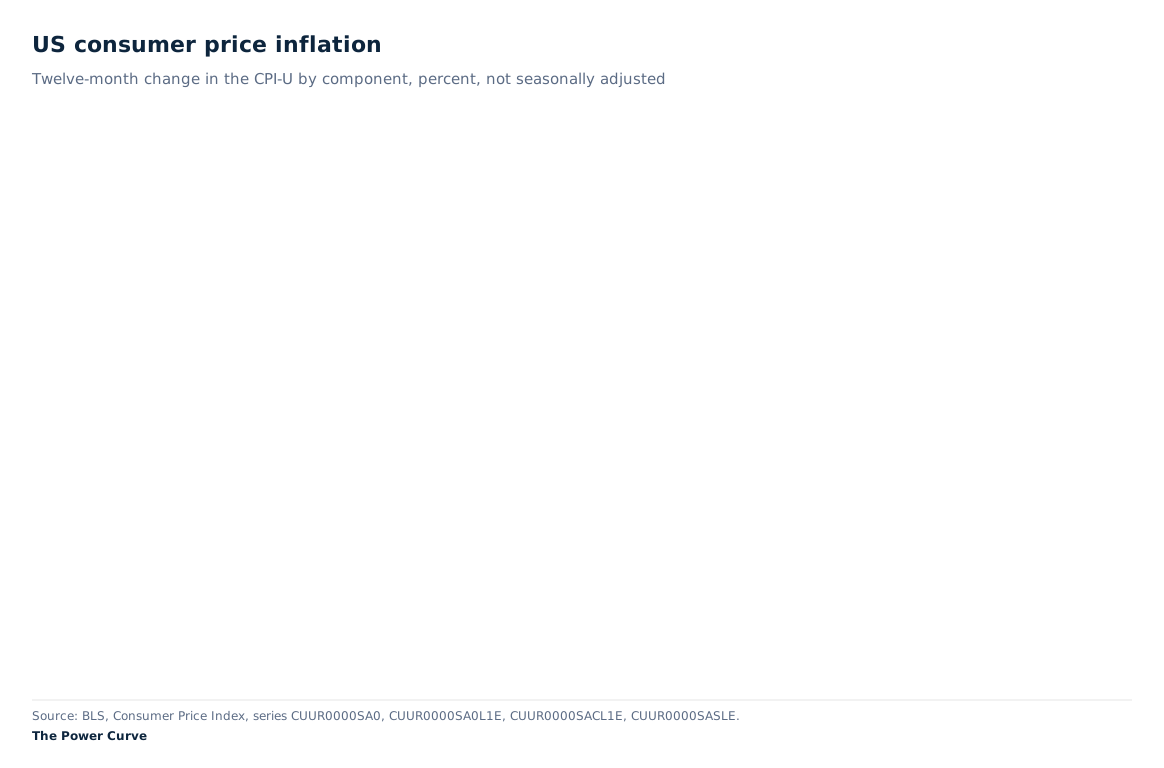
The consumer price picture is more uneven than a single inflation rate captures. Between July 2025 and July 2026, annual headline inflation rose from 2.7 to 3.4 percent. Core inflation fell from 3.1 to 2.5 percent, and core goods inflation slowed from 1.2 to 0.8 percent. Services inflation excluding energy also slowed.9
Exhibit 4 separates these categories. The increase in headline inflation accompanied slower price growth across the three other measures shown. That is useful evidence about the inflation environment, but slower inflation can coexist with a tariff-induced increase in the price level.
Exhibit 4: US consumer price inflation
Twelve-month change in the CPI-U by component, percent, not seasonally adjusted
Exhibit 4: Annual U.S. CPI inflation in July 2025 and July 2026. Headline: 2.7 to 3.4 percent; core: 3.1 to 2.5; core goods: 1.2 to 0.8; services excluding energy: 3.6 to 3.0.
View data
| Month | Headline, % | Core, % | Core goods, % | Services ex energy, % |
|---|---|---|---|---|
| Jul 2024 | 2.9 | 3.2 | -1.9 | 4.9 |
| Aug 2024 | 2.5 | 3.2 | -1.9 | 4.9 |
| Sep 2024 | 2.4 | 3.3 | -1.0 | 4.7 |
| Oct 2024 | 2.6 | 3.3 | -1.0 | 4.8 |
| Nov 2024 | 2.7 | 3.3 | -0.6 | 4.6 |
| Dec 2024 | 2.9 | 3.2 | -0.5 | 4.4 |
| Jan 2025 | 3.0 | 3.3 | -0.1 | 4.3 |
| Feb 2025 | 2.8 | 3.1 | -0.1 | 4.1 |
| Mar 2025 | 2.4 | 2.8 | -0.1 | 3.7 |
| Apr 2025 | 2.3 | 2.8 | 0.1 | 3.6 |
| May 2025 | 2.4 | 2.8 | 0.3 | 3.6 |
| Jun 2025 | 2.7 | 2.9 | 0.7 | 3.6 |
| Jul 2025 | 2.7 | 3.1 | 1.2 | 3.6 |
| Aug 2025 | 2.9 | 3.1 | 1.5 | 3.6 |
| Sep 2025 | 3.0 | 3.0 | 1.5 | 3.5 |
| Nov 2025 | 2.7 | 2.6 | 1.4 | 3.0 |
| Dec 2025 | 2.7 | 2.6 | 1.4 | 3.0 |
| Jan 2026 | 2.4 | 2.5 | 1.1 | 2.9 |
| Feb 2026 | 2.4 | 2.5 | 1.0 | 2.9 |
| Mar 2026 | 3.3 | 2.6 | 1.2 | 3.0 |
| Apr 2026 | 3.8 | 2.8 | 1.1 | 3.3 |
| May 2026 | 4.2 | 2.9 | 1.1 | 3.4 |
| Jun 2026 | 3.5 | 2.6 | 0.8 | 3.2 |
| Jul 2026 | 3.4 | 2.5 | 0.8 | 3.0 |
| Aug 2026 | 3.4 | 2.4 | 0.7 | 3.0 |
Source: BLS, Consumer Price Index, series CUUR0000SA0, CUUR0000SA0L1E, CUUR0000SACL1E, CUUR0000SASLE. Notes: Headline is all items; core excludes food and energy; core goods is commodities less food and energy commodities; services excluding energy is services less energy services. Unadjusted twelve-month percent change.
Source: BLS, Consumer Price Index, series CUUR0000SA0, CUUR0000SA0L1E, CUUR0000SACL1E, CUUR0000SASLE.
Who paid those higher costs, producer or consumer, remains a product-level question. Importers may absorb costs in margins, pass them to customers, or negotiate lower supplier prices. BLS import price indexes exclude duties, so they do not measure the full tariff-inclusive cost at the border.10 The aggregate CPI comparison cannot allocate that burden among businesses, consumers, and foreign producers.
Export Led Gains
Through July 2026, the U.S. goods and services deficit was $188.4 billion smaller than over the same period in 2025. Exhibit 5 shows exports rose $237.2 billion, and imports rose $48.8 billion.11
Exhibit 5: US goods and services trade balance
Monthly goods and services exports, imports and balance, US$ billions, seasonally adjusted
Exhibit 5: Changes in U.S. goods and services trade, January–July 2026 versus January–July 2025. Exports increased $237.2 billion, imports increased $48.8 billion and the deficit narrowed $188.4 billion.
View data
| Month | Balance, US$ bn | Exports, US$ bn | Imports, US$ bn |
|---|---|---|---|
| Jan 2024 | -63.9 | 261.6 | 325.5 |
| Feb 2024 | -63.3 | 268.5 | 331.7 |
| Mar 2024 | -61.9 | 265.5 | 327.4 |
| Apr 2024 | -70.9 | 267.6 | 338.5 |
| May 2024 | -70.3 | 266.5 | 336.8 |
| Jun 2024 | -71.3 | 269.3 | 340.6 |
| Jul 2024 | -77.0 | 271.3 | 348.3 |
| Aug 2024 | -71.2 | 275.8 | 347.0 |
| Sep 2024 | -83.3 | 273.3 | 356.6 |
| Oct 2024 | -75.8 | 269.8 | 345.6 |
| Nov 2024 | -79.8 | 276.7 | 356.4 |
| Dec 2024 | -96.8 | 270.6 | 367.5 |
| Jan 2025 | -124.7 | 274.8 | 399.5 |
| Feb 2025 | -117.1 | 280.5 | 397.6 |
| Mar 2025 | -133.0 | 283.4 | 416.4 |
| Apr 2025 | -60.3 | 290.6 | 350.9 |
| May 2025 | -66.7 | 282.2 | 349.0 |
| Jun 2025 | -58.7 | 281.0 | 339.7 |
| Jul 2025 | -75.1 | 284.2 | 359.2 |
| Aug 2025 | -59.6 | 284.7 | 344.4 |
| Sep 2025 | -59.4 | 292.4 | 351.7 |
| Oct 2025 | -37.4 | 301.2 | 338.5 |
| Nov 2025 | -63.9 | 289.5 | 353.4 |
| Dec 2025 | -76.1 | 285.3 | 361.4 |
| Jan 2026 | -52.7 | 301.3 | 353.9 |
| Feb 2026 | -52.5 | 313.6 | 366.1 |
| Mar 2026 | -53.7 | 321.2 | 374.8 |
| Apr 2026 | -52.9 | 329.9 | 382.8 |
| May 2026 | -75.8 | 320.0 | 395.7 |
| Jun 2026 | -71.2 | 317.3 | 388.5 |
| Jul 2026 | -88.6 | 310.7 | 399.3 |
Source: Census Bureau and BEA, U.S. International Trade in Goods and Services (FT-900), as republished by FRED: BOPTEXP, BOPTIMP, BOPGSTB. Notes: Balance of payments basis, seasonally adjusted, nominal. The January to July comparisons in the essay are the sums of these months.
Source: Census Bureau and BEA, U.S. International Trade in Goods and Services (FT-900), as republished by FRED: BOPTEXP, BOPTIMP, BOPGSTB.
The arithmetic is straightforward. Export growth exceeded import growth by the amount the deficit narrowed. Imports continued to expand. The gain paints a different picture from the reduction in imports from a particular trading partner.
These are nominal, seasonally adjusted flows. All are influenced by prices, exchange rates, demand, and shipment timing. The exhibit identifies the accounting contribution of exports and imports, but it does not attribute that contribution to tariffs or the dollar.
Compute Drove July’s Increase
The monthly picture shifted dramatically in July, when the goods and services deficit widened by $17.4 billion to $88.6 billion. Capital goods imports rose $14.4 billion, with computing-related infrastructure accounted for the increase.11
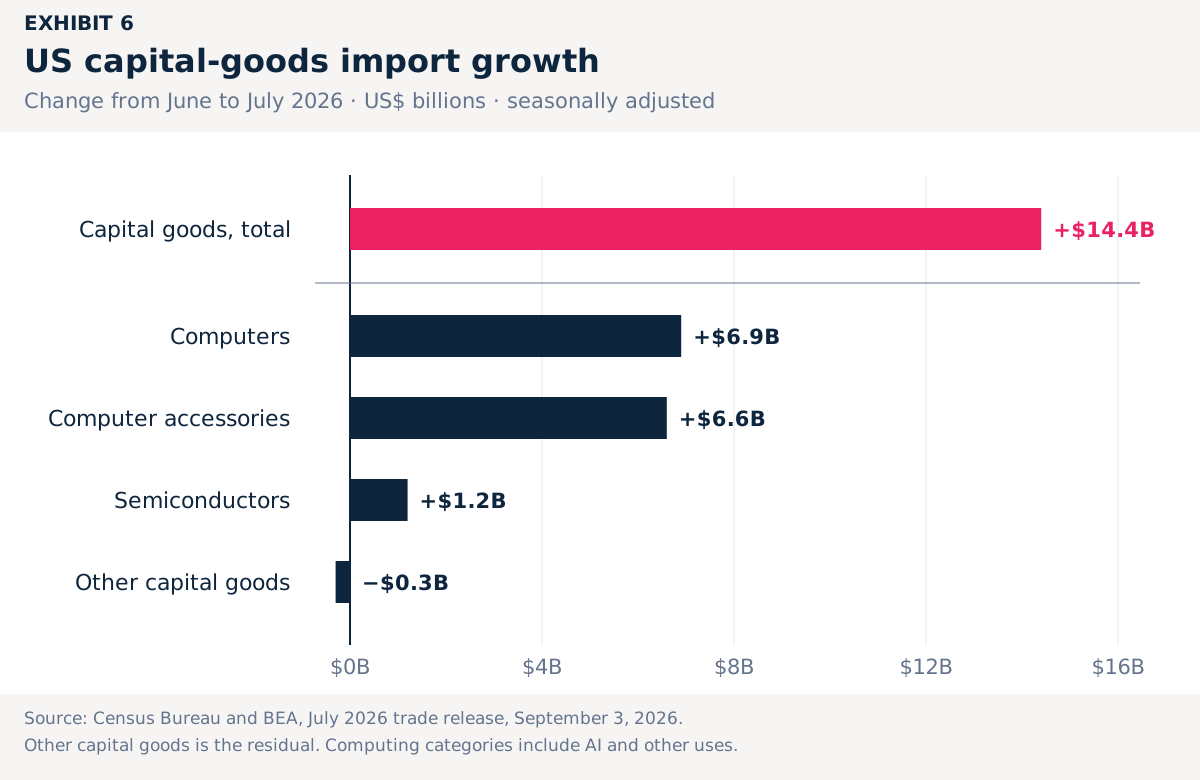
The three computing categories sum to $14.7 billion, slightly above the category’s net increase, and the −$0.3 billion residual reconciles the components with the total.
The exhibit makes investment demand legible in the trade balance. Computers, accessories, and semiconductors power AI infrastructure. Their growth shows how capital spending can sustain imports, even during a period with elevated trade barriers. The customs categories identify the equipment, but they do not identify its final use.
What the Six Exhibits Show
The tariff unwind was significant and multi-dimensional. Federal receipts reversed. China’s global surplus expanded. U.S. bilateral deficits shifted across suppliers. Consumer price measures diverged. Export growth narrowed the year-to-date trade deficit, while computing imports helped widen July’s balance.
Together, the exhibits show an economy adjusting through trade routes, prices, and investment. Each of these adjustments should be evaluated separately on its merits.
The clearest failure remains the legal foundation of the IEEPA revenue stream. The administration projected years of additional tariff receipts, but the government is now returning duties collected under an authority the Supreme Court rejected.12 Meanwhile, other tariff revenue mechanisms continue, and the broader economic effects remain mixed.