Loading reports … Fetching the current index of long-form research.
Reports
Loading reports … Fetching the current index of long-form research.
2026 is the year of capability concentration, institutional drift, and the multi-pole order.
The 2026 system has finished its transition from the post-Cold-War single-architecture order to something new. The headline language of fragmentation and decoupling captures the visible churn but misses the deeper movement: power is consolidating inside each pole faster than the institutions overseeing those poles can govern it. The United States runs the world's largest research, capital, and compute base, alongside its most concentrated equity market, its largest mandatory-spending gap, and its weakest federal delivery capacity in two decades. China runs 28% of world manufacturing value added1 and has closed most of the frontier-model performance gap on a fraction of US AI investment2. Europe is rearming on a fiscal foundation that does not yet support the commitment3.
The question that defines the year is conversion. Capital, compute, capacity, and security commitments have all been announced at scale. Whether any pole can convert announcements into deployable capability inside the planning horizon is the live question.
Six findings frame the year ahead.
AI capability concentration. Four hyperscalers will spend roughly $700 billion in 2026 capital expenditure, of which about 75% is AI-specific4.
Industrial competition. China's manufacturing value added of $4.7 trillion now roughly equals the United States, Japan, and Germany together1.
Geopolitical fragmentation. World military expenditure reached $2.89 trillion in 2025, with European spending up 14%, even as the SIPRI US print fell on a one-year Ukraine-aid effect3.
Labor and productivity. US nonfarm labor productivity rose 2.1% in 2025, while the federal civilian workforce shed roughly 220,000 employees, about 10% of the civilian total5, 6.
Institutional stress. Net interest outlays first exceeded national defense in FY2024 and are projected to reach $2.1 trillion by 20367.
Capital realignment. The top ten S&P 500 companies carry roughly 40% of index weight, an all-time high8.
The bottom line for 2026: capability and risk are stacking on top of the same handful of platforms, balance sheets, and capitals. That stack is what 2026 has to manage, and what 2027 will stress.
1. $700B. 2026 hyperscaler capex (four firms).
2. 23×. US-to-China private AI investment ratio, 2025.
3. $2.1T. Projected US net interest outlays, FY2036.
The first-order story of 2026 is that capability inside each pole has moved at different speeds across the industrial, scientific, and security dimensions. The poles no longer keep all three in lockstep, and the asymmetries within each pole are widening.
China commands 28% of world manufacturing value added: $4.7 trillion in 2024 dollars1. That is approximately equal to the United States, Japan, and Germany combined (China $4.7T against a combined US, Japan, and Germany total of roughly $4.6T on 2024 MVA). The ratio peaked at 30.3% in 2021 and has settled in a narrow band since. The absolute scale keeps rising. The United States produced 16% of world MVA in 2024. The world's two largest manufacturers together account for 44% of global output.
Exhibit 1. Two decades, two trajectories.
Slope chart of global manufacturing value added share, 2004 to 2024, China, US, Germany, Japan.
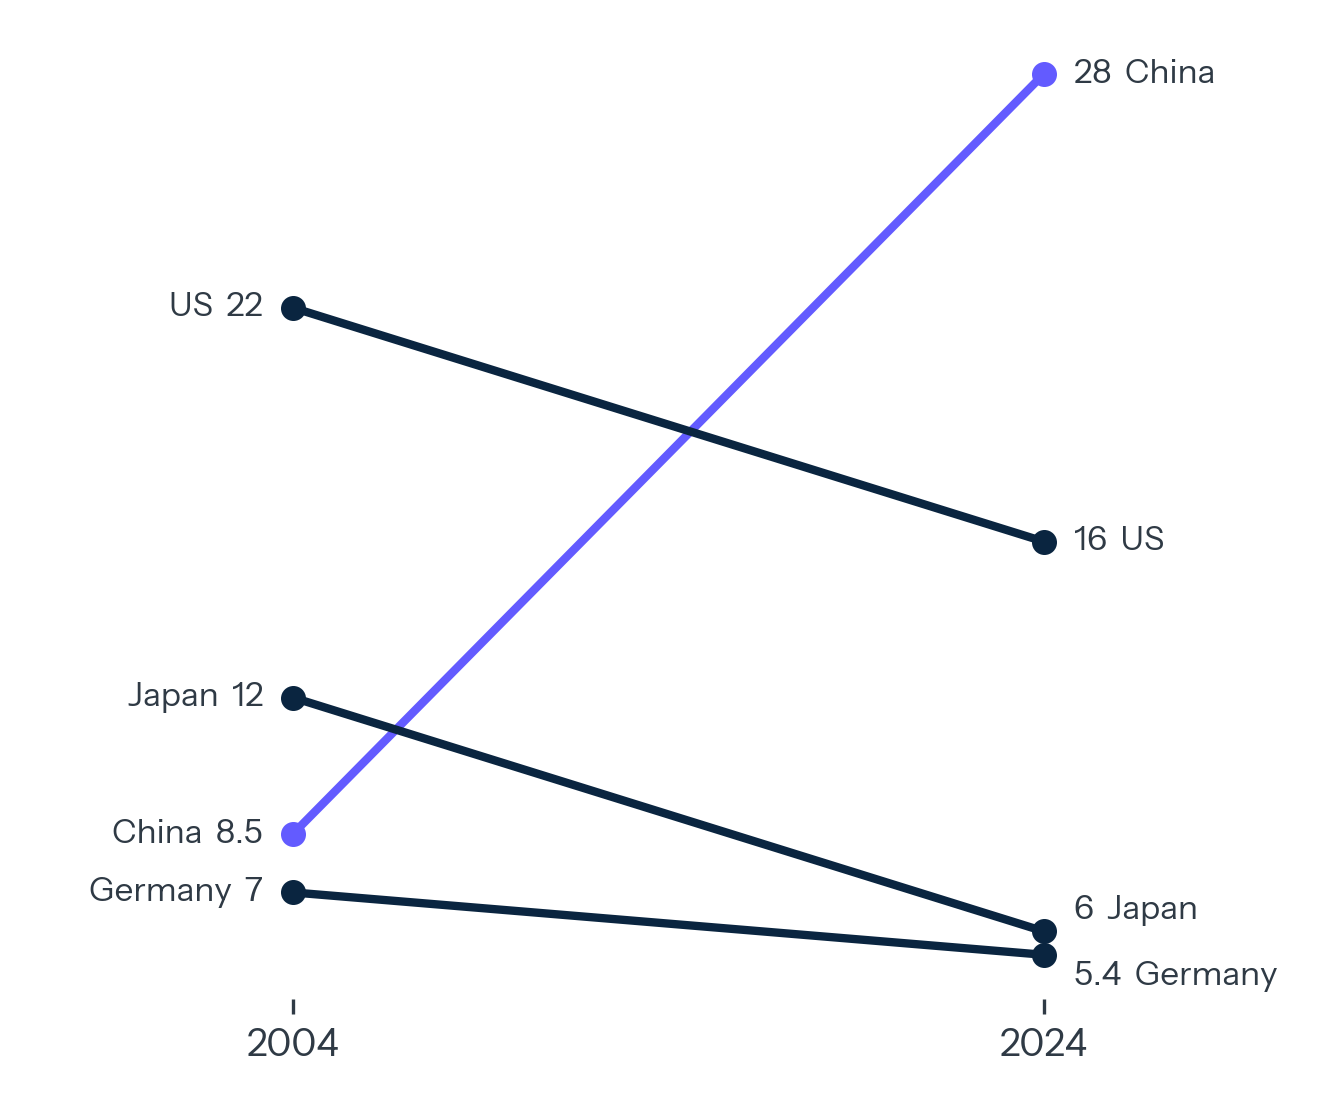
The asymmetry is decadal. In 2004, China held 8.5% of global MVA, less than Japan. Twenty years later, China holds nearly twice the share of the United States. No comparable concentration has occurred in any industrial dataset since the United States' own postwar peak in the late 1940s.
The pattern under that aggregate matters more than the aggregate. China's industrial base has moved up the technology curve in three distinct phases. Low-cost assembly through the 2000s. Mid-tier electronics and capital goods through the 2010s. Frontier-adjacent manufacturing in EVs, batteries, drones, solar, and increasingly mature-node semiconductors through the early 2020s. The third phase is the structurally consequential one. It depends on industrial commons that the United States built and then dismantled, using technology generally available to US firms.
The US response, CHIPS and IRA, has produced its first wave of physical capacity. The Semiconductor Industry Association tracks more than $630 billion in announced private investment across 140 projects since the CHIPS Act passed in 20229. Commerce has finalized over $36 billion in direct CHIPS funding awards as of November 2025, including $7.86 billion to Intel, $6.6 billion to TSMC, and $6.4 billion to Samsung. The arithmetic of finished capacity is more sobering. Boston Consulting Group and SIA estimate that the US share of leading-node logic capacity will reach 14% by 203210, below the 2001 level.
The CHIPS and IRA wave depends on federal capacity to administer it. The Commerce Department, which runs CHIPS implementation, and the Energy and Treasury Departments, which run the IRA loan and tax-credit machinery, are operating with roughly 10% fewer staff than they had in January 20256. The capital is committed, but converting it to operating capacity now depends on agencies running with reduced execution headroom.
The industrial-policy logic has also widened beyond semiconductors. The Inflation Reduction Act has obligated, depending on how one counts uncapped tax credits, somewhere between $400 billion and $1.2 trillion over its ten-year lifetime. Subsequent administration changes have rolled back parts of the clean-energy stack, but the capital that has already entered the ground in Arizona, Texas, Georgia, Ohio, and Tennessee is doing what industrial capital does. It is creating skilled labor demand, training pipelines, and supplier ecosystems that did not exist five years ago.
The question that defines 2026 is the rate of modernization. The current data point to a slow path. China's manufacturing output grew 6.0% in 2024 and 6.1% in 202511. US manufacturing output grew 0.9% in 2024 and 1.4% in 2025. The absolute gap is widening even as the US share stabilizes.
Supply chains have responded faster than the industrial base. Mexico became the United States' top trading partner in 2023 and held that position through 2025. Vietnam, India, and ASEAN broadly have absorbed the China-substitution premium, but the substituted goods often embed Chinese intermediate inputs at rates that the US customs system cannot fully observe. China's recorded share of US imports has fallen from 21.6% in 2017 to 13.4% in 202412. Its share of world goods exports has continued to expand over the same period, from approximately 13% to 16%. The trade architecture has been rerouted. The volume has been preserved.
National capability is the underrated dimension. The Defense Production Act invocations, the Defense Industrial Strategy of 2023, the AUKUS submarine arrangement, and the Pacific Deterrence Initiative all reflect a recognition that strategic capability now requires industrial inputs that no longer reside in CONUS. The Navy cannot field its planned hull count without forging capacity that does not exist domestically. The Air Force cannot meet its planned bomber sortie rate without rare-earth processing capacity that is approximately 90% Chinese-controlled13. The fight for national capability in 2026 is being run inside agencies that have been reorganized, downsized, and in some cases functionally suspended.
The military expenditure data carries the same conversion story. World military expenditure reached $2.89 trillion in 2025, the eleventh consecutive year of growth3. Total European spending (SIPRI's all-Europe aggregate, including Russia, Ukraine, and non-NATO members) rose 14% to $864 billion, the second consecutive year of double-digit real-terms increases after the 17% rise SIPRI recorded for 2024. The 29 European NATO members, a subset of that aggregate, spent $559 billion combined, with Germany at $114 billion (+24%) and Spain at $40.2 billion (+50%, the largest single-year jump in the SIPRI series and the first year Spain's military burden has exceeded 2% of GDP since 1994). The Bundestag's budget committee approved 103 major procurement projects worth €83 billion in 2025, the highest annual total since the modern series began; cumulative approvals between 2023 and 2025 reached 255 projects worth €188.4 billion, against 215 projects worth €109 billion across 2015 to 202214. Those numbers establish the fiscal commitment; whether the European industrial base can absorb a doubling of defense procurement inside a five-year window is the separate, harder question. Germany's Bundeswehr procurement system has been the subject of multiple 2024 and 2025 reform packages aimed at accelerating delivery, an indication that the appropriation-to-delivery friction is structural.
US military spending registered $954 billion in 2025, a 7.5% real-terms decline3. SIPRI attributes the bulk of the drop to no new Ukraine military assistance being approved during the year, against $127 billion across the prior three years. The reversal is already programmed: FY2026 enacted appropriations already sit above $1.0 trillion (national-defense function 050 basis), and the administration's FY2027 request reaches $1.5 trillion (a $1.15 trillion base request plus a proposed $350 billion mandatory reconciliation tranche), the largest defense budget request in US history15. Because the 2025 drop reflects a single year of withheld Ukraine aid, the structural signal lies elsewhere, in the interest-expense channel described in Section 3.
The strategic competition turns on conversion. Whether either side can convert what it has into deployable capability within the next planning horizon is the operative question. Each pole faces a different ceiling. China's is institutional sophistication; the US ceiling is institutional capacity, the subject of Section 4.
The compute super-cycle has crossed the threshold from a technology story to a macro story. Hyperscaler capital expenditure for 2026 will reach approximately $700 billion across Microsoft, Alphabet, Amazon, and Meta4, up from $388 billion in 2025. Roughly 75% of that spend, approximately $525 billion, is AI-related infrastructure: data centers, accelerator silicon, networking, and power-conversion equipment. Adding Oracle, the five-firm 2026 base is approximately $760 billion.
Exhibit 2. From a software cost line to a fixed-capital line. Hyperscaler annual capex by company, 2020 to 2026E.
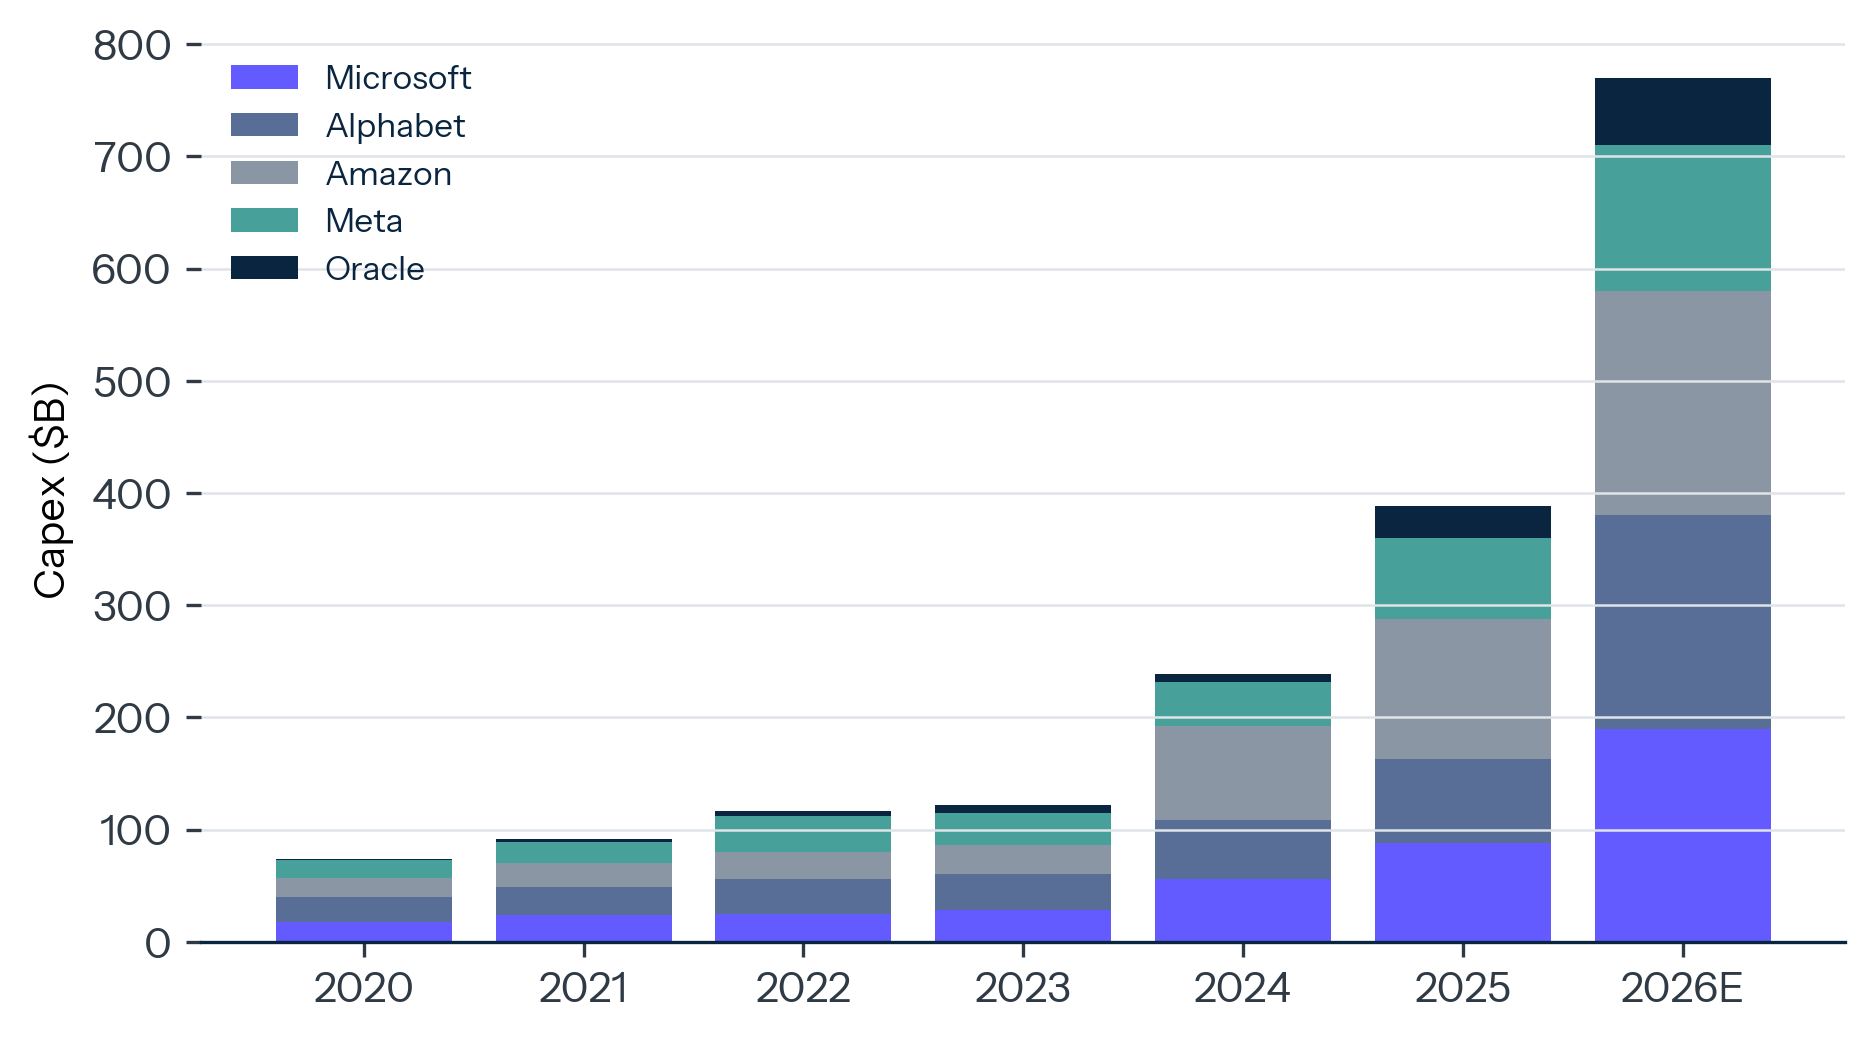
In a few weeks of 2026 earnings calls, AI moved from a software cost line to a fixed-capital line in the GDP accounts, something years of strategy papers had not accomplished. The Bureau of Economic Analysis recorded AI-related fixed investment as a growing share of US business investment through 2025. By Q1 2026 it had become the single largest category of information-processing equipment investment in the BEA series16. That is a structural shift in how the US economy invests.
The capex is concentrating in fewer hands than the public debate suggests. Five companies, Microsoft, Alphabet, Amazon, Meta, and Oracle, accounted for roughly 73% of US AI infrastructure capex in 2025 and are projected to retain a similar share in 2026. Of those five, three (Microsoft, Alphabet, Amazon) control the majority of the cloud-frontier-model integration stack. The frontier-model landscape is more concentrated still. OpenAI, Anthropic, Google DeepMind, xAI, and Meta produce essentially all of the US-headquartered models that score in the top decile of MMLU-Pro, GPQA, and SWE-Bench Verified evaluations. Outside the United States, three Chinese laboratories (DeepSeek, Qwen/Alibaba, and Zhipu/Z.ai) hold the equivalent position.
The US-China frontier gap is the most-watched dimension of advanced technology, and it has compressed substantially. The 2024 Stanford HAI AI Index reported double-digit US leads (in the 17 to 31 percentage point range) on major frontier benchmarks. The 2025 edition reported them compressed to single digits, with the open-versus-closed model gap narrowed to approximately 1.7%. The 2026 edition reports them in low single digits on multiple measures2. On the public LMArena leaderboard as of May 2026, the top US frontier model leads at Elo 1504, with several US models (Claude Opus 4.6, Gemini 3.1 Pro Preview, GPT-5.x) inside overlapping 95% confidence intervals at the top. The leading Chinese open-weight models (Zhipu's GLM-5/5.1, DeepSeek V4 Pro Max, Qwen3.5 variants) sit within roughly 25 to 80 Elo points of the leader, depending on the snapshot and evaluation17. A January 2026 LMArena methodology revision shifted scores by approximately 30 points and limits the comparability of older snapshots on that platform.
Exhibit 3. The gap is now in low single digits.
Top US frontier model vs leading Chinese open-weight models (top, mid-pack, trailing), LMArena Elo, May 2026 snapshot.
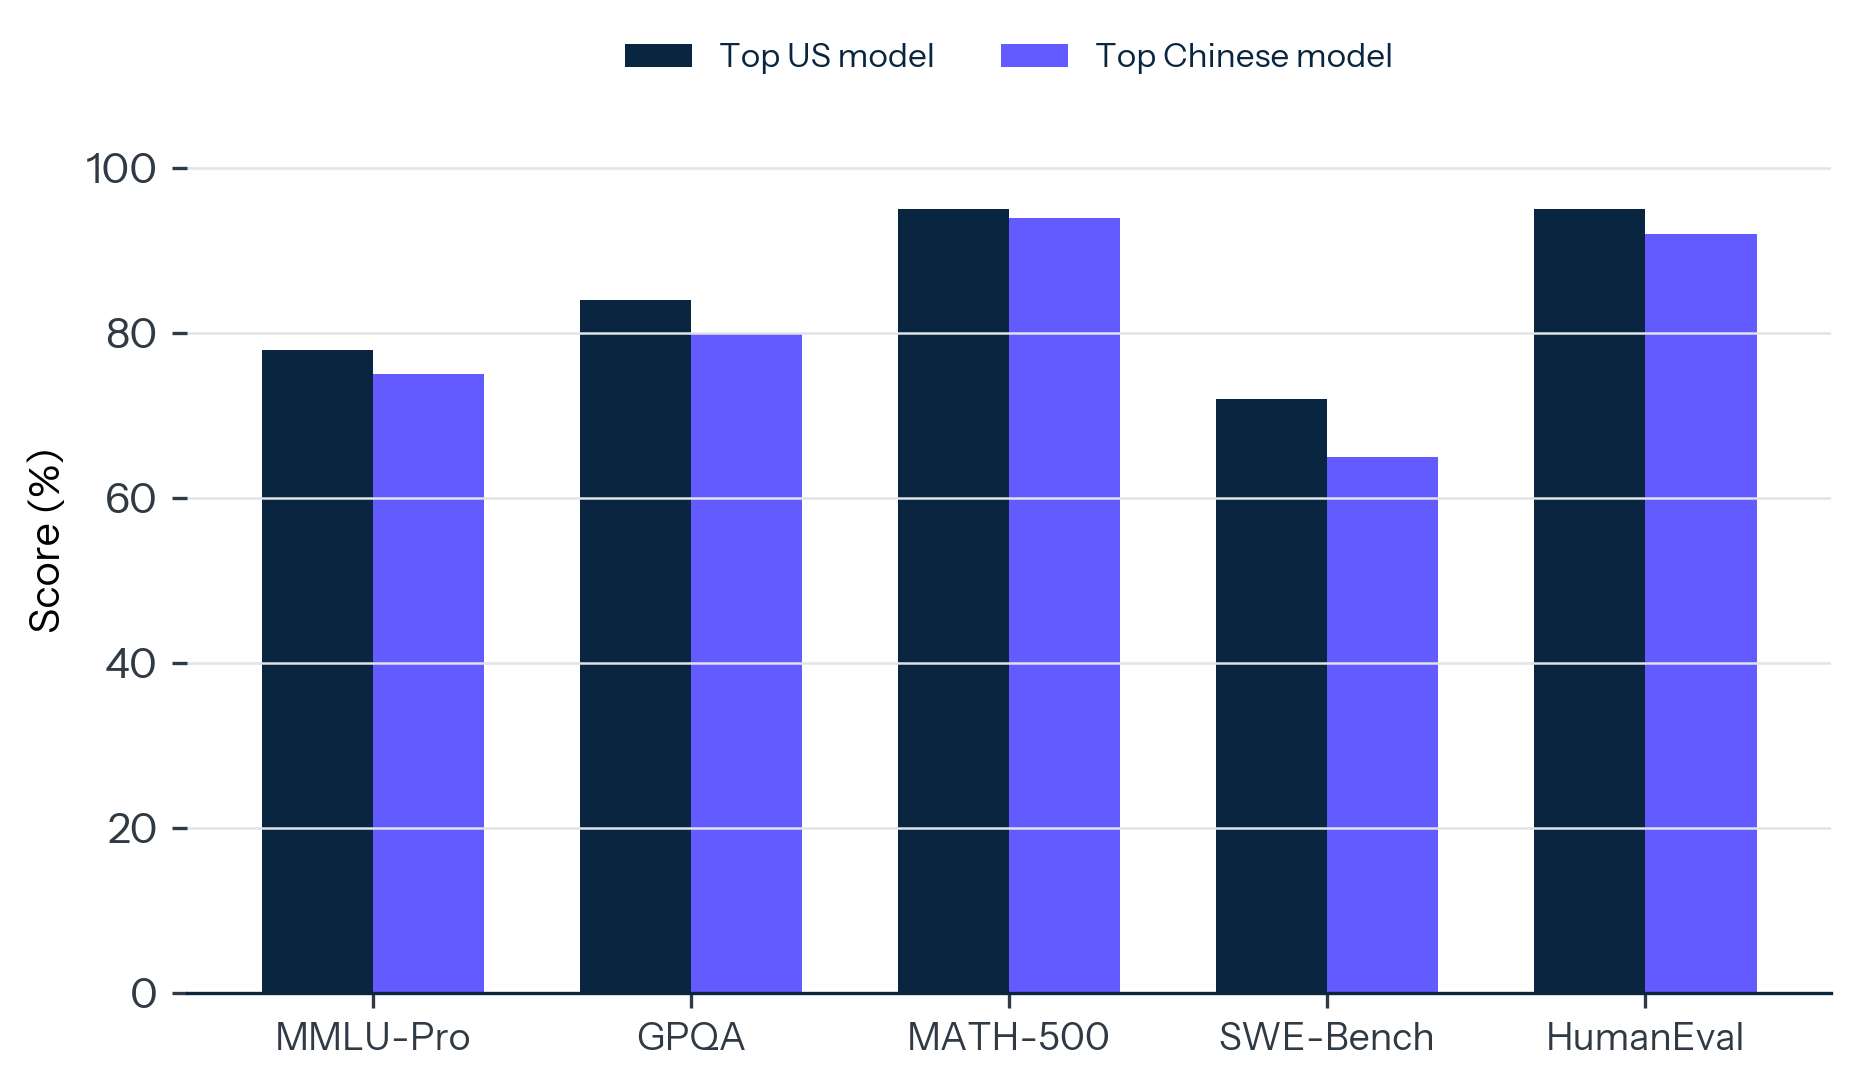
The Index records private AI investment of $285.9 billion in the United States and $12.4 billion in China for 20252. The US spends roughly twenty-three times more, and the technical lead is narrower than at any point in the modern AI cycle.
The explanation is structural. Chinese labs have benefited from the absence of large advertising-driven cost structures, from open-source training recipes, from a state policy that allocates compute through national plans, and from the work of the open-weight ecosystem that the United States itself seeded. Meta released Llama 2 with open weights in July 2023. The downstream effects of that release on Chinese frontier development cannot be cleanly measured, but they are visible in the codebases, training recipes, and weight inheritance patterns of every leading Chinese open-weight model released since (see DeepSeek's own technical reports, Qwen model cards on Hugging Face, and the academic literature tracing Llama lineage)17. The open-weight question is now the most strategically consequential AI policy question of the year.
Automation crossover is producing the first measured productivity gains of the cycle. McKinsey's 2025-2026 State of AI surveys report that 71% of organizations regularly use generative AI in at least one business function (up from 65% in early 2024), and that 78% use AI of any type in at least one business function18. Scale and ROI lag adoption: only about one third report scaling AI across the organization, and more than 80% report no measurable enterprise-level EBIT impact. Anthropic's Economic Index, derived from anonymized usage on Claude, finds that computer and mathematical tasks represent approximately one third of Claude.ai traffic and nearly half of API traffic in early 202619. The Bureau of Labor Statistics has not yet published productivity series detailed enough to attribute output gains specifically to AI deployment, but the aggregate US nonfarm productivity number of +2.1% in 2025 is consistent with a small positive contribution at the macro level.
The defense-tech crossover is the dimension most likely to surprise to the upside in 2026. The Department of Defense has allocated $1.8 billion to AI research in FY26, plus $1.3 billion to autonomous systems20. Those numbers understate the real defense AI exposure, because the integrated capability now flows through Chief Digital and AI Office partnerships with private frontier labs (Anthropic, OpenAI, Palantir, Scale AI) and through Replicator-program autonomous systems contracts. The signature programs of the Pentagon's 2025 transformation, including the JADC2 backbone, the Replicator drone effort, and the Maven AI battlefield-targeting system, all assume frontier-model integration at scale. The strategic implication for 2026 is that the AI capex line on hyperscaler balance sheets and the AI capability line on national-defense balance sheets are now upstream of the same set of facilities, the same talent pool, and the same accelerator supply. The federal personnel pulling those threads together at CDAO, NIST, and the AI Safety Institute is the institutional layer most directly exposed to the workforce contraction described in Section 4.
The compute supply chain is the chokepoint. NVIDIA data center revenue reached $193.7 billion in FY2026 (year ended January 2026), up from $115.2 billion in FY2025; Q4 FY2026 alone produced $62.3 billion in data center revenue21. The H200 and B200/B300 production capacity at TSMC's CoWoS packaging facility runs at functional saturation. Memory pricing has risen sharply through 2025 and 2026, with HBM3e and HBM4 capacity allocated to NVIDIA and AMD on multi-year offtake agreements. The bottleneck has migrated from raw silicon to advanced packaging, from packaging to memory, and from memory to power. The next chokepoint is grid capacity, which is the subject of Section 3.
Capital, compute, and energy now operate as a single triangle that defines the constraint set for the next investment cycle. Each leg is running at structural limits.
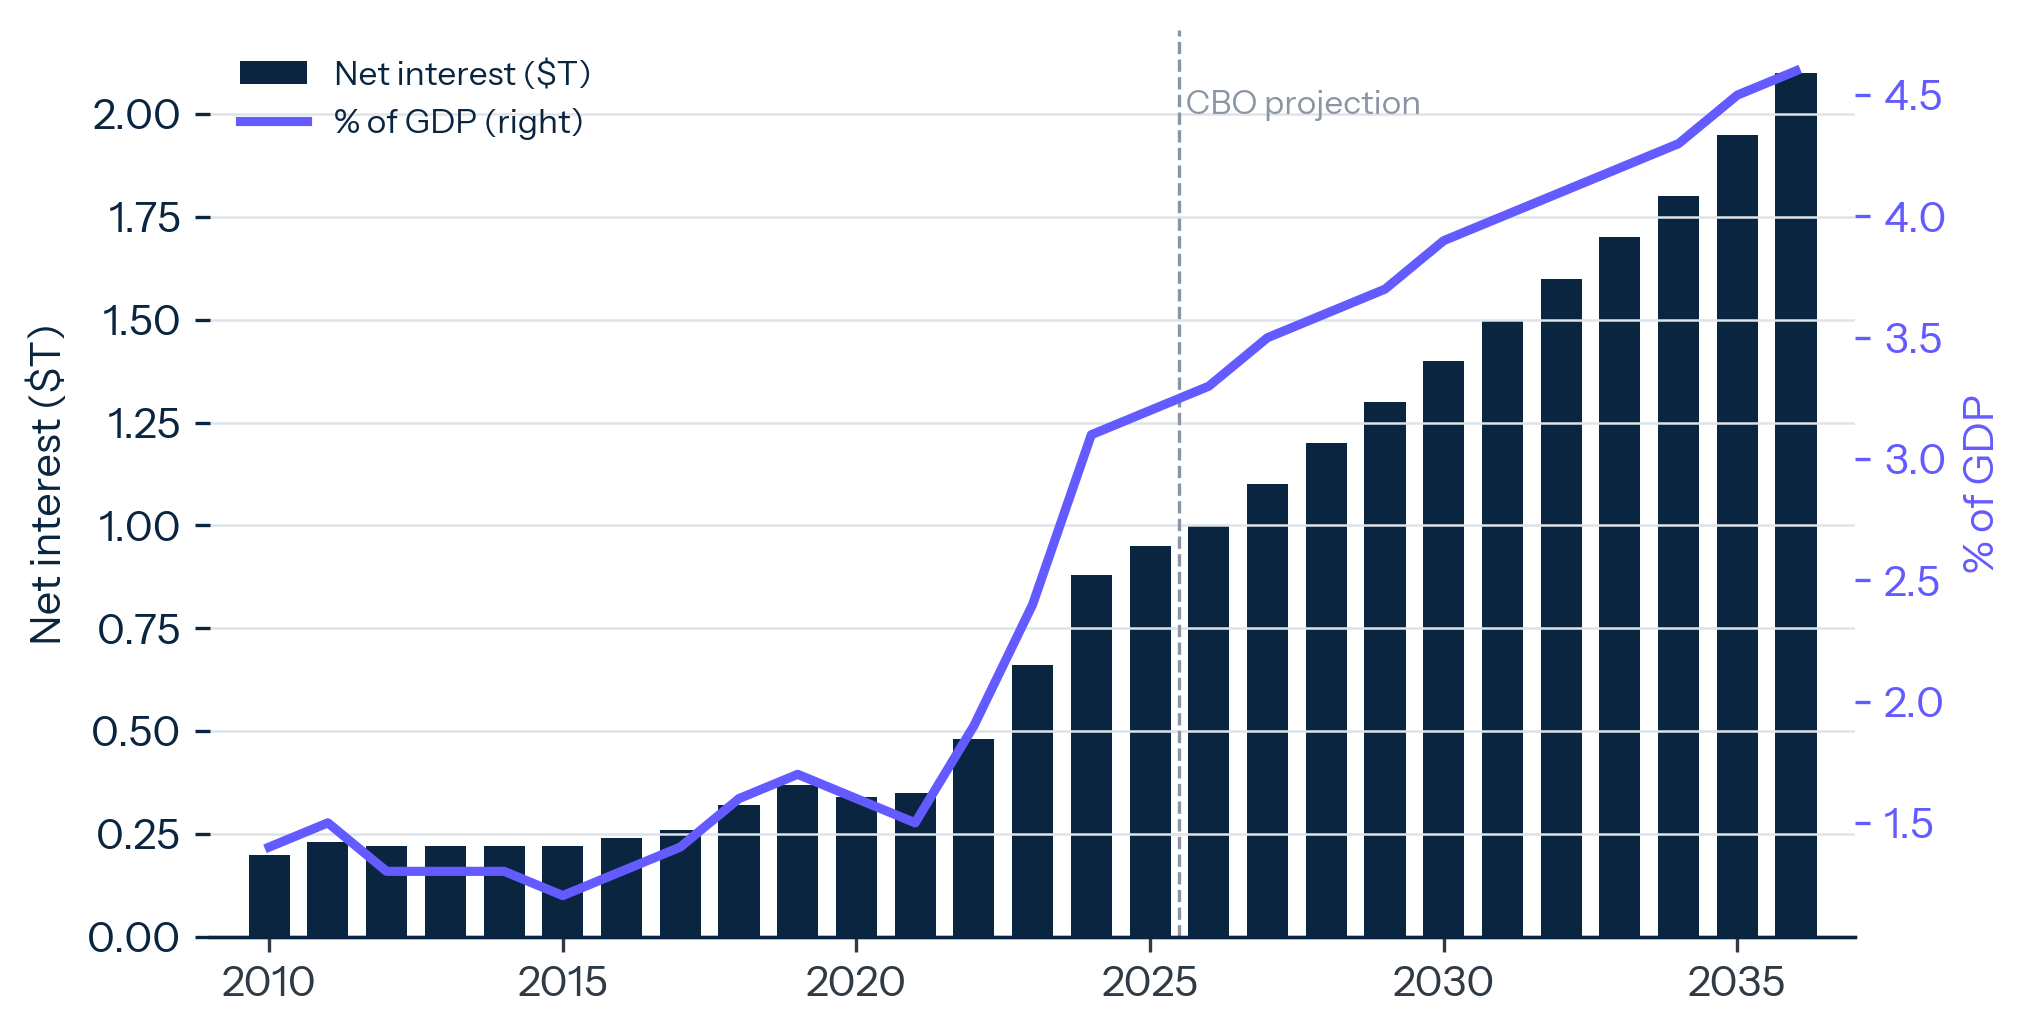
US federal interest expense crossed the threshold the Congressional Budget Office's pre-2020 baseline did not anticipate. Net interest outlays exceeded national defense for the first time in FY2024 ($879.9 billion versus $850.7 billion)7. They will reach $1.0 trillion in FY2026 and $2.1 trillion in FY2036. As a share of GDP, net interest rises from 3.3% in 2026 to 4.6% in 2036 and 6.9% by 2056. CBO projects that net interest will exceed all discretionary spending by 2038. Interest expense is a structurally rising line item that does not respond to economic growth, fiscal restraint, or political consensus. It responds only to the path of yields, the path of debt, and the maturity schedule of the existing stock.
Exhibit 4. A structural line item.
US federal net interest, $T (left) and % of GDP (right), 2010 to 2036E.
The implications for strategic capacity are direct. Every $100 billion of additional annual interest expense is $100 billion that does not fund defense, research, infrastructure, or industrial policy. Allies negotiating with the United States in 2026 are negotiating with a country in which interest expense already exceeds defense spending, with the gap projected to widen to roughly two-to-one by 2036 on the CBO baseline (the FY2027 $350 billion reconciliation tranche, if approved, is a one-time augmentation not embedded in the recurring CBO defense baseline). The 2025 NATO summit commitment to 5% of GDP defense spending by 2035 has to be priced against this trajectory. The institutional muscle to administer joint US-European defense industrial programs, run through agencies that lost a tenth of their staff in the last twelve months, is the rate-limiter on how quickly the alliance can convert commitments into hardware.
Equity markets are the other side of the same ledger. The top ten companies in the S&P 500 carry roughly 40% of index free-float weight in May 2026, the highest concentration in the modern history of the index8. The Magnificent Seven (Nvidia, Microsoft, Apple, Amazon, Alphabet, Meta, Tesla) account for 34.8% of the index. Five of those seven are also the hyperscalers driving the AI capex super-cycle described in Section 2.
Exhibit 5. Concentration above the dot-com peak.
S&P 500 top-10 share of index free-float weight at three reference points: pre-2010 norm, dot-com peak (Mar 2000), May 2026.
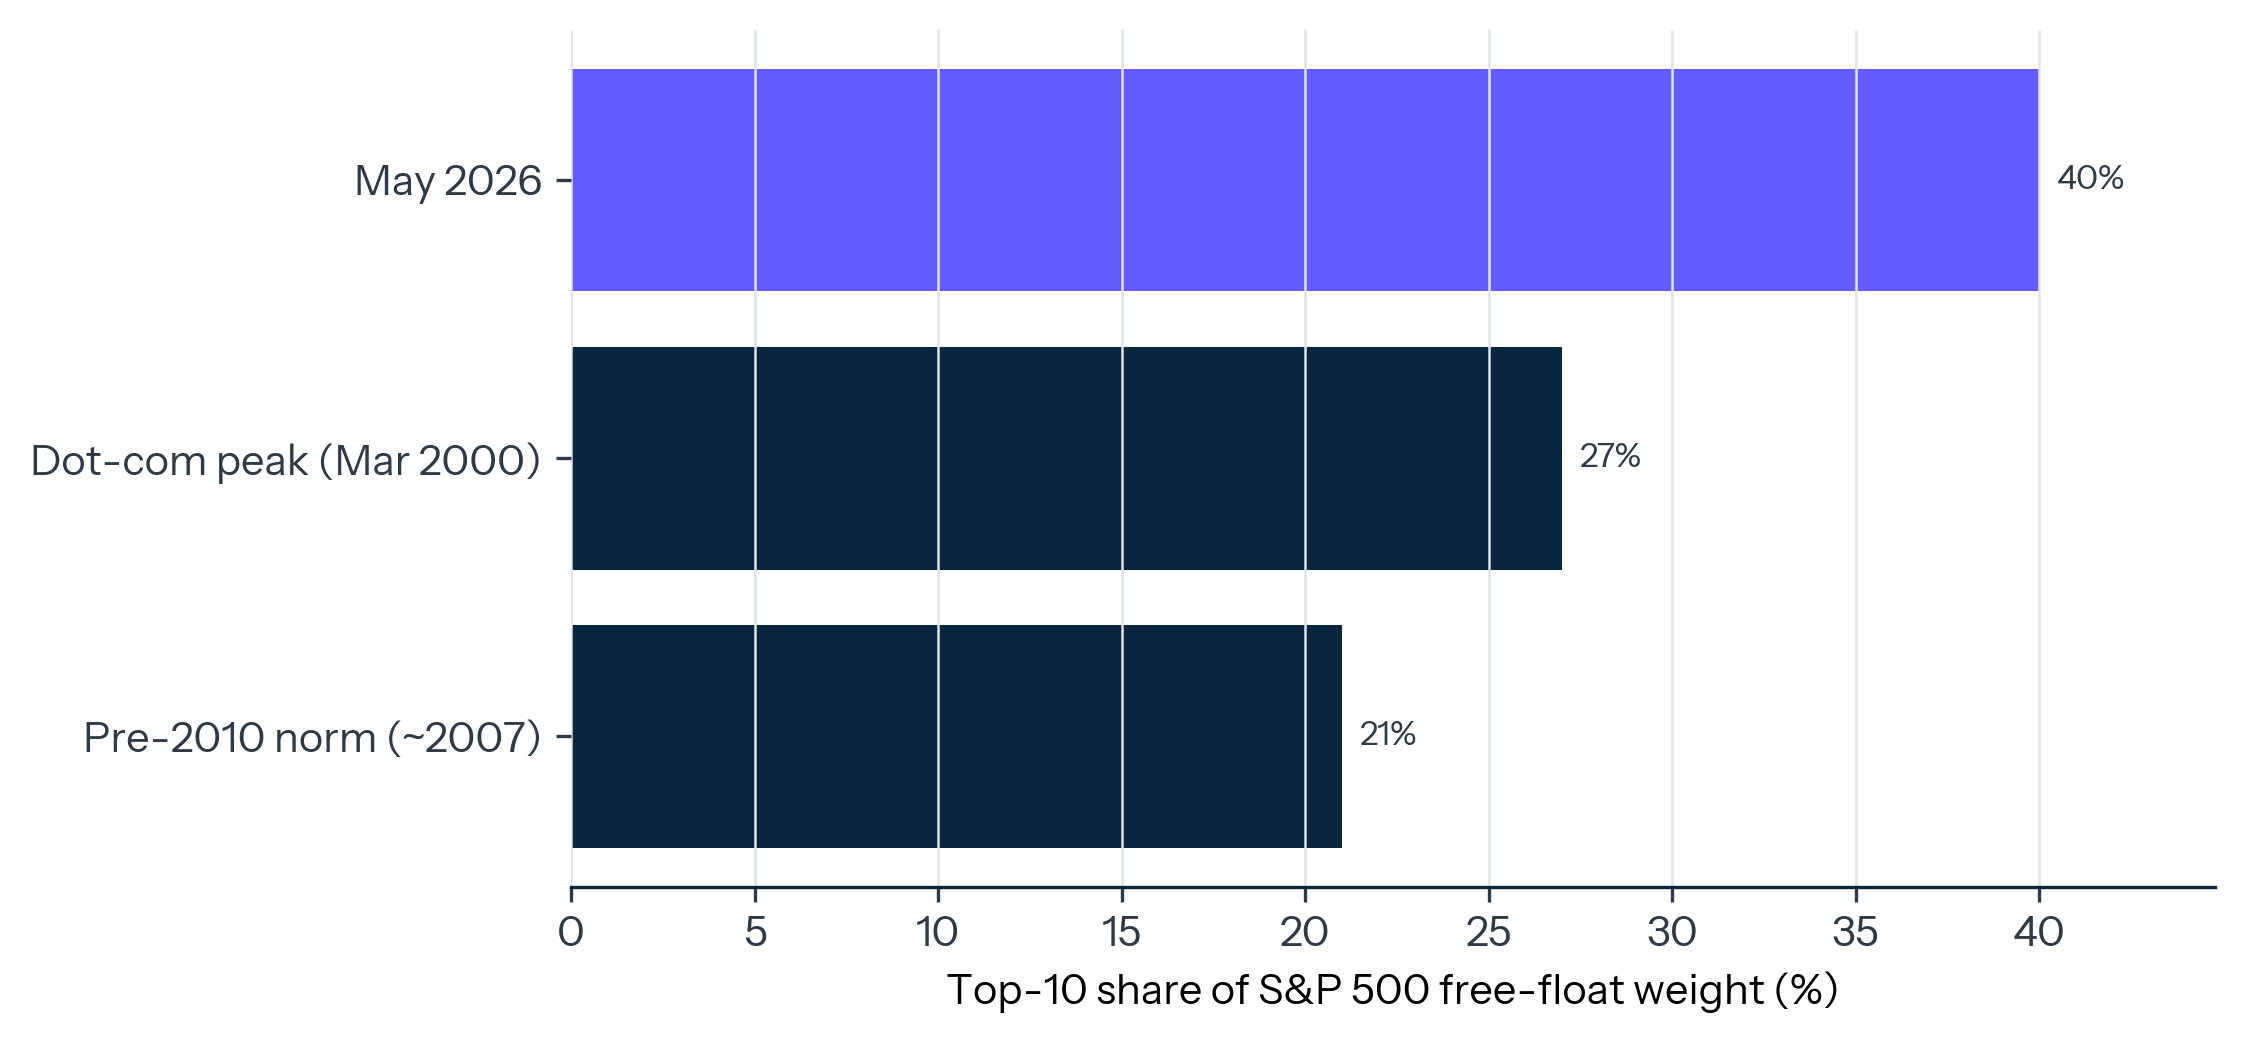
The concentration matters for three reasons. First, mechanically: passive flows now amplify any directional move in the top names disproportionately, as the academic literature on passive-flow price impact has documented22. Second, fundamentally: the same names are the largest fixed-investment line in the US economy, so an AI capex revaluation moves both their share prices and the GDP accounts in the same direction. Third, by exposure: every diversified passive equity portfolio in the world now has roughly 40% of its US-equity allocation in ten names, eight of which are technology, six of which are AI-exposed. The equity-market concentration is structurally larger than the dot-com peak and is concentrated in a narrower industrial subset.
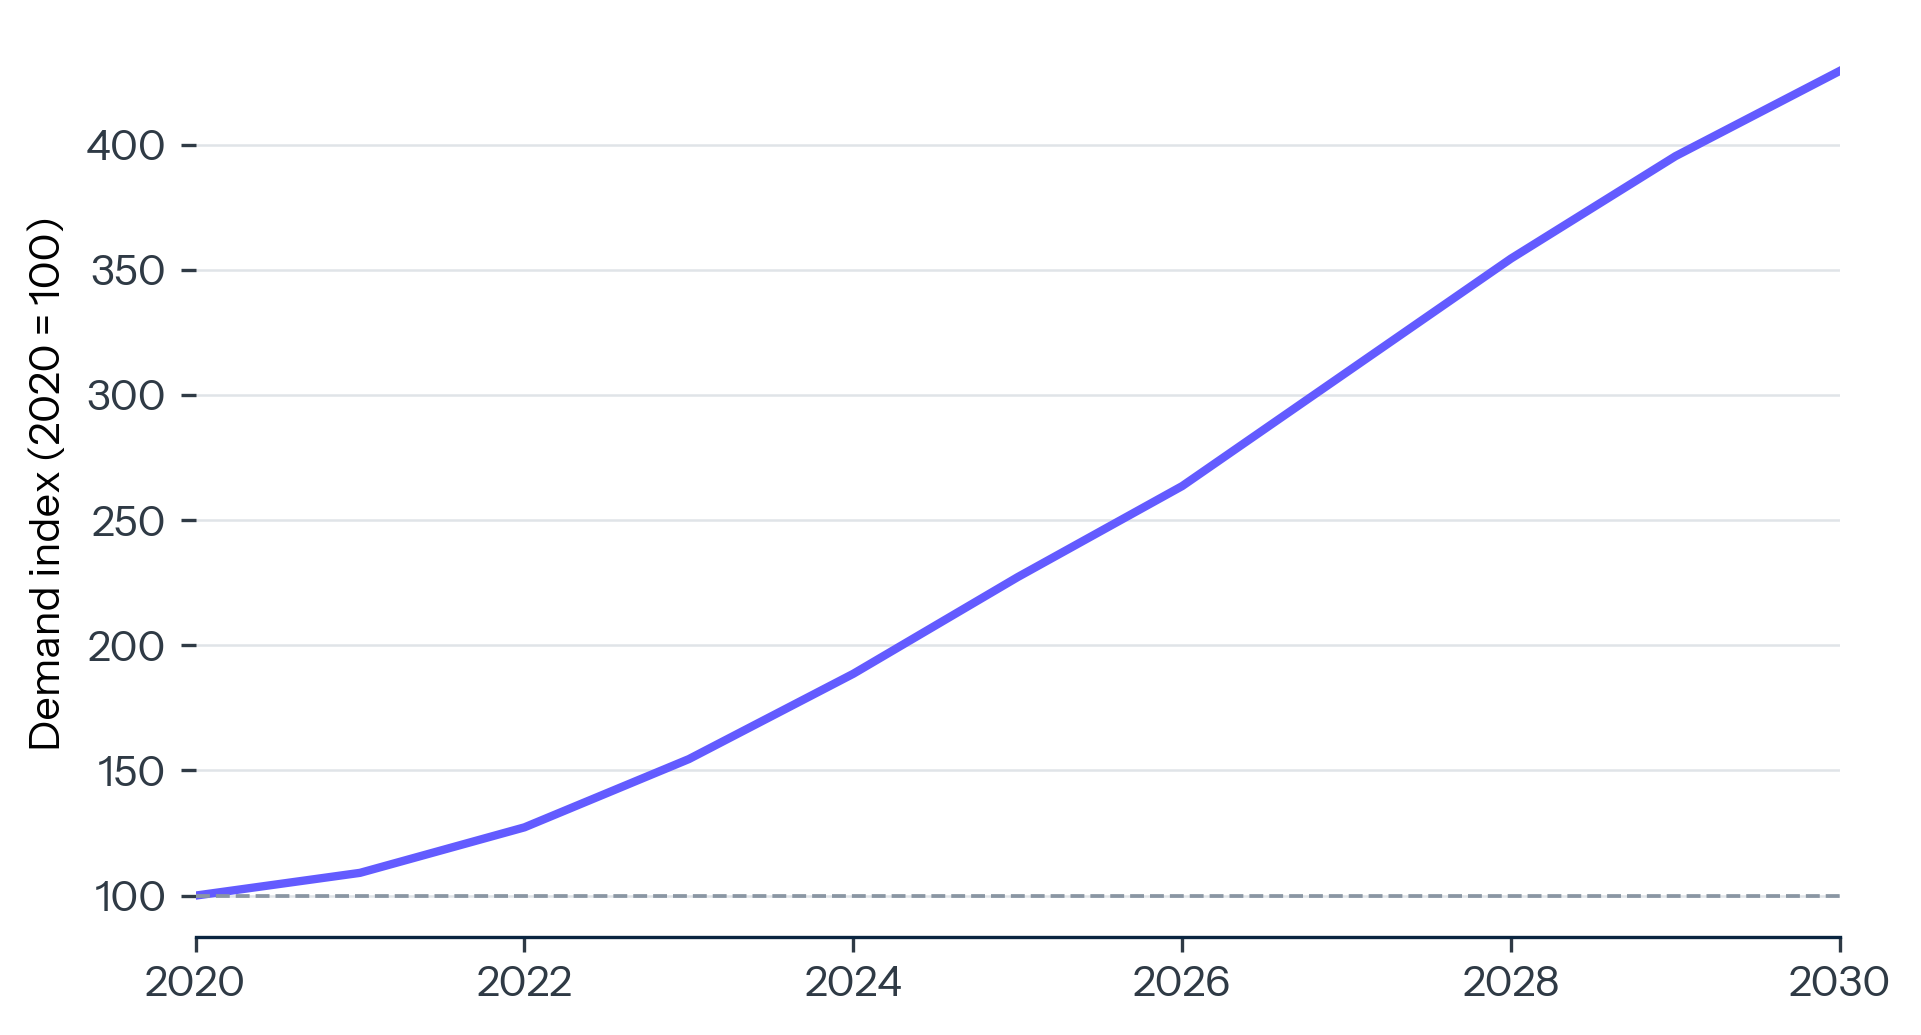
Energy is the third leg. The International Energy Agency projects global data center electricity demand to roughly double from 415 TWh in 2024 to 945 TWh by 203023. Approximately 80% of the growth occurs in the United States and China. US data center demand alone will rise by 240 TWh by 2030, the equivalent of adding the entire current electricity consumption of Australia. The compounding effect is non-linear. Data center capex requires power, power requires grid capacity, grid capacity requires permitting and construction, and permitting and construction have multi-year lead times that already exceed the planning horizons of the AI build-out. The grid is the variable that the three poles cannot import.
The financial fragmentation question is real but slower-moving than the headlines suggest. The IMF's COFER data shows the US dollar share of allocated reserves at 56.92% in Q3 202524, sitting close to the multi-decade low recorded in Q2 2025 (56.32%, the lowest reading since 1995). The functional dollar (88% of FX transactions, more than 80% of commodity invoicing, 60% of international debt) is essentially unchanged. The reserve dollar is eroding at the margin while the transactional dollar holds. Central banks reallocating away from dollars in 2025 went predominantly to gold, which set its fifth consecutive record year of central-bank purchases, and to a smaller extent to renminbi-denominated assets. The shift is consequential at the central-bank level and small at the corporate-treasury level, which is why the macro effect on US Treasury financing costs has been muted.
The capital story of 2026 is that the three legs of the triangle, fiscal, equity, and energy, are tightening simultaneously. The base case is that the system absorbs the tightening because the alternatives are worse for every participant. The tail risk is that one leg fails in a way that propagates to the others.
State capacity is the dimension of the 2026 outlook that markets are underpricing. It is also the dimension most directly under the control of the political process, which makes its path the least predictable.
US nonfarm labor productivity grew 2.1% in 2025 on the annual-average basis, decelerating from a revised 2.7% in 20245. Both numbers are above the 2010 to 2019 average of 1.5%, and both sit at or below the 1948 to 2000 average of 2.7%. The AI productivity payoff that capital markets have been pricing for the last three years is not yet visible in the BLS aggregate. The most likely explanation is sequencing. The capex precedes the deployment, the deployment precedes the workflow change, the workflow change precedes the output gain. The lag from semiconductor adoption to measurable productivity ran approximately a decade in the 1980s and 1990s. If AI follows a similar lag structure, the measured payoff arrives in 2027 to 2030.
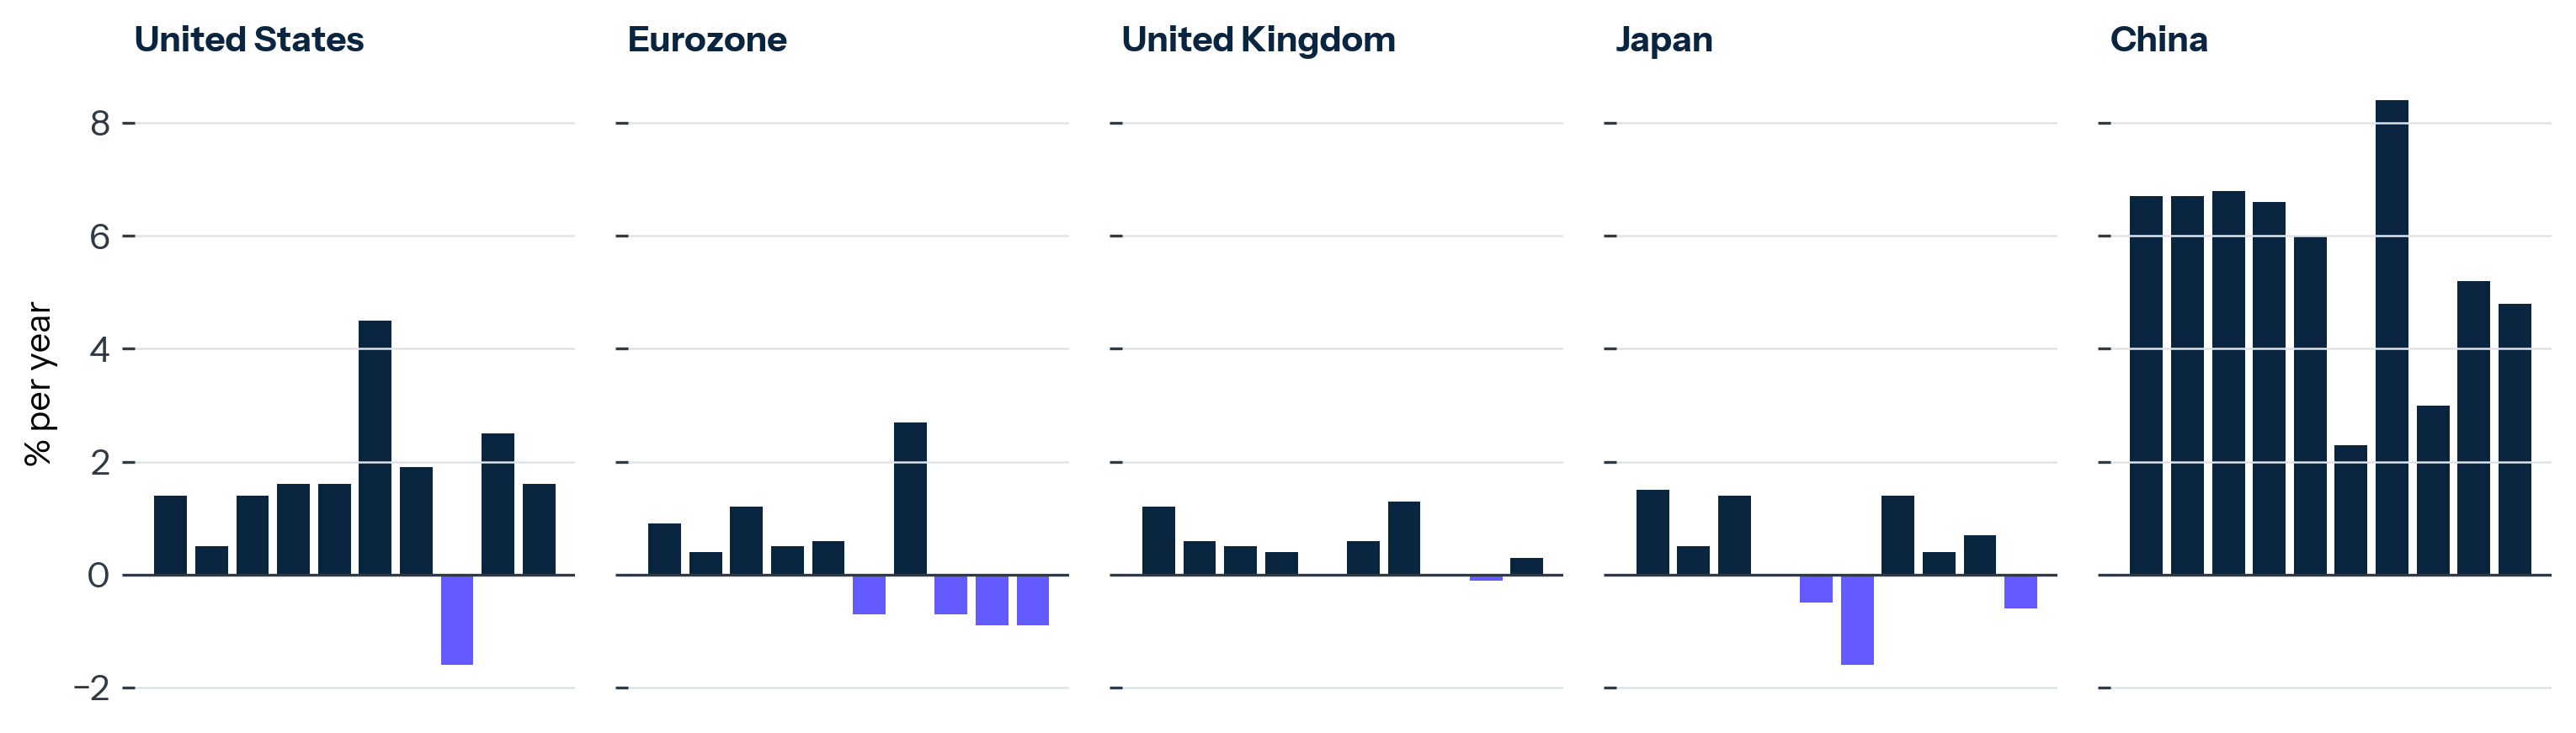
Cross-country productivity divergence is a defining feature of the modern advanced-economy environment, and the cleanest cross-country comparison runs a year behind the US series. On 2024 data, OECD's 2025 Compendium of Productivity Indicators reports that labor productivity growth averaged approximately 0.4% across OECD countries, with the United States at 1.6% on the OECD's harmonized series (the BLS annual-average figure on the domestic series is higher, at 2.7%, reflecting methodology differences), the euro area at -0.9% (the steepest drop since 2009), and Japan at -0.6% (the first decline in four years)25. The Conference Board's Total Economy Database, the standard non-OECD reference, places China at approximately 4.8% labor productivity growth for 202426. The United States and China are the two large economies running at productivity rates compatible with their fiscal trajectories. Europe is not, and the gap is now opening to a scale that will affect transatlantic policy coordination for the rest of the decade.
Exhibit 6. The advanced-economy gap.
Annual labor productivity growth, 2015 to 2024, US vs Eurozone vs UK vs Japan vs China.
Federal capacity is contracting in measurable ways. OPM data through November 2025 records a net loss of approximately 220,000 federal civilian employees in calendar 2025 (322,000 separations against 102,000 hires), roughly 10% of the civilian workforce6. The losses are concentrated in agencies that administer the industrial-policy programs the 2026 outlook depends on. Commerce administers CHIPS implementation, Treasury runs IRA tax credits, Energy operates the loan programs and grid permitting, and the National Science Foundation funds the research base. The Government Accountability Office records a parallel decline in agency operational performance metrics for procurement, grant management, and program oversight between Q1 and Q4 20256.
Education and workforce capacity have moved more slowly than the news cycle suggests, and in the same direction. The most recent OECD PISA results, from 2022, show US 15-year-olds scoring at the OECD average in reading, below average in mathematics, and approximately at the OECD average in science. The 2025 cycle results are due in late 2026. The National Assessment of Educational Progress data, released in January 2026, shows continued decline in fourth- and eighth-grade reading and mathematics scores relative to 2019 baselines. The cohort entering the labor market in 2030 is the cohort that absorbed the pandemic learning loss.
Organizational adaptation is the bright spot, and it is happening in the private sector. The McKinsey 2025-2026 State of AI surveys, the Anthropic Economic Index, and BCG's productivity tracker all record substantial workflow change in knowledge-work organizations through 2025 and into Q1 2026. Software engineering, legal research, financial modeling, customer service, and content production are the five functions where enterprise generative-AI adoption has crossed 50%. The aggregate productivity impact remains small, but the cross-sectional variance is large and widening. Firms in the top decile of AI adoption are reporting output-per-employee gains in the double-digit percentage range, while firms in the bottom quartile report flat or negative gains. The dispersion will continue to open through the back half of 2026.
Public-sector AI deployment is proceeding in parallel. The Department of Veterans Affairs completed the nationwide rollout of its External Provider Scheduling system in late 2025, enabling staff to book up to 25 community-care appointments per day against a previous baseline of a handful, with AI document-processing tools (AIEFF) producing measurable time savings on community-care paperwork at the Bay Pines pilot and follow-on sites27. The Department of Defense has deployed AI tools across logistics, sustainment, and intelligence pipelines through the CDAO partnerships described in Section 2. These deployments are real wins. They are also occurring inside an institutional environment that lost 10% of its civilian workforce in the year they were rolled out. The sustainability of the gains depends on whether the remaining workforce can absorb the process change that AI deployment requires while also absorbing the workload that the departed staff carried.
The strategic implication is that institutional capacity is the binding constraint on US execution of the rest of the 2026 outlook. Industrial policy works if Commerce can run it. NATO commitments work if Treasury can finance them. AI safety works if NIST and the AI Safety Institute can resource it. The current trajectory of federal capacity does not support the policy ambitions of the current strategic posture. Either the capacity comes back, or the ambitions trim down. The middle case, ambitions held and capacity declining, produces the kind of public-policy disappointment that converts to political backlash within an election cycle.
The 2026 outlook resolves into three scenarios, distinguished by which constraint binds first and whether the disturbance propagates beyond the equity index. The probability weights below are subjective base rates, calibrated to the indicators identified in What to Watch.
Managed concentration. The base case, with a probability we read at approximately 55%. The AI capex super-cycle continues at or near current trajectories. Productivity gains begin to show in the BLS series in 2027 to 2028. US-China competition runs in the structurally asymmetric mode described in Section 1 without escalating to direct military confrontation. The European rearmament program operates at two-thirds of its announced 5% target through 2030. The US fiscal trajectory holds at CBO baseline. Equity markets absorb the AI capex build-out in 2027 to 2028 with a 15 to 25% drawdown in the AI-exposed names that does not propagate to credit spreads, employment, or consumption. Top-decile firms compound their advantage. The world looks more like 2025 than 2020.
Fractured consolidation. Read at approximately 30%. The defining feature is propagation: the disturbance spreads beyond the AI cluster. High-yield credit spreads widen by 200 basis points or more, labor markets in the AI-build-out states soften, consumer spending pulls in, and the wealth-effect feedback to discretionary consumption becomes measurable in the BEA series. The most likely trigger is the energy leg. Grid capacity fails to keep pace with data center demand in two or three critical regions (Northern Virginia, Phoenix, Ohio). AI infrastructure deployment slows by 12 to 18 months. The marginal-return calculation on hyperscaler capex deteriorates. The Federal Reserve responds with rate cuts inside a fiscal regime in which the interest-expense trajectory limits the rate-cut runway. The system stabilizes at a lower level. Institutional capacity remains the binding constraint on recovery.
Kinetic shock. Read at approximately 15%. A geopolitical event forces the system into a war-economy posture for which neither the US fiscal balance, the European industrial base, nor the global commodity-flow architecture is prepared. The most-watched triggers are a Taiwan blockade, Iranian closure of Hormuz, a North Korean missile launch with payload to Tokyo or Seoul, or a Russian incursion beyond Ukraine. Energy spikes. Dollar liquidity tightens. Equity markets correct 30% or more in the affected regional indices. The Federal Reserve has limited fiscal cover for an aggressive response. The system rebases at a lower trajectory and a more bilateral architecture.
Exhibit 7. The energy constraint at the center of the fractured-consolidation scenario.
Global data center electricity demand, 2020 to 2030E (2020 = 100).
The scenarios are not equally informative. The managed-concentration case is the macro the system has already partly priced. The fractured-consolidation case is the one whose triggers are visible in real-time data and whose risk markets are not adequately discounting. The kinetic-shock case is the one against which institutions in 2026 have the least preparatory capacity.
The investment frame. Capital, compute, and energy operate as a single integrated system. Allocations into one leg without consideration of the other two will produce regret. The portfolio question is compute-energy-capital integration exposure. The firms that compound through 2030 are the ones that operate at the intersection of all three.
Industrial policy. The CHIPS and IRA wave has produced the capital expenditure. The next four years are about whether the United States can produce the workforce, the supplier base, and the permitting velocity to convert capex into operating capacity. Without those three, announced investment remains announced.
Allies. European partners are budgeting against US commitments that the US fiscal trajectory may not support beyond 2030. The headline number to watch is the interest-expense path described in Section 3, which is the structural constraint. The 2025 SIPRI defense print is a Ukraine-aid artifact and a poor proxy for the structural variable. The strategically prudent response is to plan for the United States as the primary security underwriter through the rest of this decade, with declining marginal fiscal capacity over the same horizon. European industrial-base regeneration is a fiscal necessity disguised as a strategic preference.
China. The frontier-model gap closing changes the international market for non-US frontier capability. Most of the global south will purchase Chinese frontier models for sovereignty, cost, and language reasons. The export-control regime needs to be designed for a world in which the cutting edge does not depend on US compute supply. That world arrives well before 2030.
Institutional repair. Federal capacity is the binding constraint on every other line of policy. Rebuilding agency capacity is a topic for the next quarter. Deferring it to the next administration loses every quarter of CHIPS Act execution in between. Every year of capacity that the Commerce Department does not have is a year of CHIPS Act execution that does not happen.
Markets. The equity-market concentration is mechanical and likely to persist until either passive flow dynamics change or a top-name drawdown forces portfolio re-weighting. Active management should plan for a regime in which the index moves on a handful of names and the rest of the market moves on different fundamentals. The cross-section is wider than the headline.
Through the second half of 2026, six indicators carry the most signal.
1. Hyperscaler 2027 capex guidance will arrive in Q4 2026 earnings calls. If combined guidance comes in below $750 billion, the AI capex super-cycle is decelerating in a way that propagates to NVIDIA, TSMC, the memory makers, and the regional grids that have been racing to keep up. If guidance comes in above $850 billion, the trajectory continues.
2. US grid permitting through FERC Order 2023 implementation. Interconnection queues exceed 2,600 GW nationally. The speed at which that queue clears determines whether the data-center build-out hits its 2027 to 2028 capacity targets.
3. CBO's August 2026 update to the long-term budget outlook. The interest-expense trajectory is the macro variable most likely to surprise the market in the next twelve months.
4. Chinese frontier model releases through 2026 H2. If DeepSeek, Qwen, or Zhipu releases a model that matches or exceeds the top US frontier on three or more major benchmarks, the export-control architecture loses a meaningful share of its strategic value.
5. European defense budgets in the 2027 fiscal cycle. The 5% pledge is a 2035 target. The 2027 budget submissions are the first multi-year planning round in which the pledge has to be costed against real fiscal constraints. The variance across member states will be wide.
6. NATO and ROK-Japan capability integration with the United States. The trilateral and trilateral-adjacent arrangements (AUKUS Pillar 2, US-Japan-ROK security cooperation, Quad Plus) are the institutional channels through which US strategic posture in Asia operates. Their throughput is observable in joint exercise tempo, basing arrangements, and integrated industrial commitments.
The bottom line for 2026: the system is running toward an arrangement in which a small number of firms, balance sheets, and capital pools inside each pole carry an outsized share of total capability. The concentration inside each pole matters more than the rivalry between them. How concentrated the stack has become, and how few decision-makers inside each pole are now in a position to move the macro, is the curve to watch. The names on the curve change. The shape does not.
