Loading reports … Fetching the current index of long-form research.
Reports
Loading reports … Fetching the current index of long-form research.
Winning, Losing, and Competing in the 21st Century
| 2.2% | $2.71T | 72% |
|---|---|---|
| 2010s average world GDP growth | Global military spending in 2024 | U.S. share of global private AI investment |
The world economy has entered a slower-growth regime. In a world expanding at 5% a year, several powers can advance simultaneously, fiscal trade-offs remain manageable, and geopolitical tension is easier to absorb. At 2.5%, competition becomes more distributive. Trade policy grows more coercive, industrial policy gains political appeal, and national advantage increasingly depends on how effectively states convert economic output into military capacity, technological leadership, and institutional resilience.123
Measured against that standard, the United States retains the strongest overall position, though its lead is conditional. China is gaining rapidly in selected industrial and military domains while accumulating substantial demographic, financial, and institutional liabilities. Europe remains wealthy and capable, yet converts its assets into strategic power too slowly. Russia is generating wartime output by consuming the foundations of future growth.456 The emerging order is unlikely to restore the permissive conditions of the high-globalization era. The more probable path is sharper competition under tighter economic constraints.
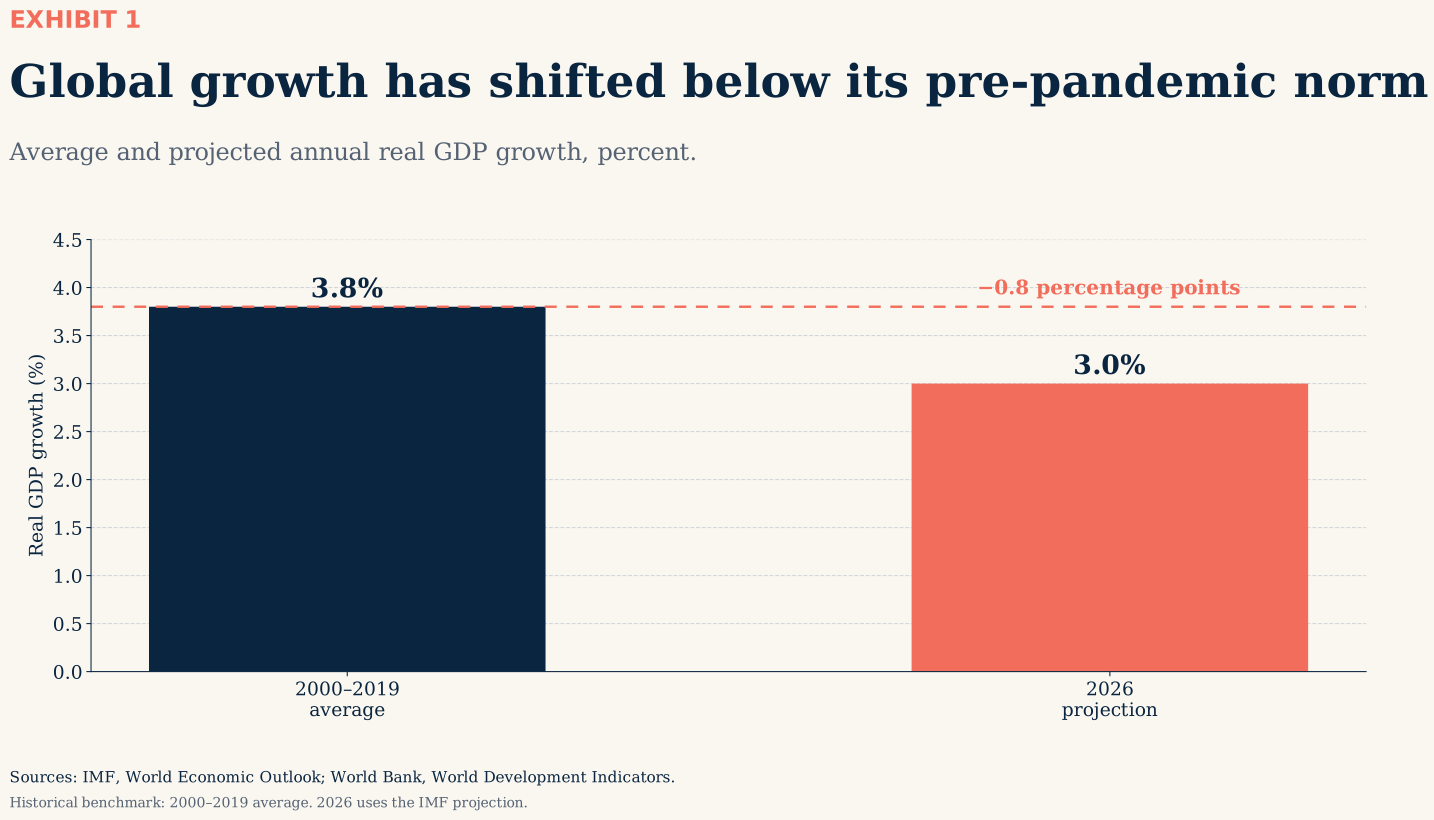
Power has a balance sheet. Its assets include output, human capital, technology, energy access, alliance networks, financial depth, and institutional capacity. Its liabilities include debt, adverse demographics, weak capital allocation, excessive security commitments, political fragmentation, and institutional erosion. This framework matters because the world economy has been losing momentum for decades. Global growth averaged more than 5% a year between 1950 and 1973.2 It fell to 3.7% during the 1970s, 3.1% during the 1980s, 2.8% during both the 1990s and 2000s, and 2.2% during the 2010s, the weakest complete decade in the modern record.3 The exceptional rebound of 2021 temporarily lifted the average, but the underlying trajectory remains much closer to 2.5% than to 5%.
That shift helps explain much of the current geopolitical environment. Slower growth reduces the economic slack available to reconcile competing claims. Trade, industrial policy, energy security, migration, military spending, and access to capital all become harder to manage when aggregate gains are smaller. Rapid expansion allows governments to fund new priorities without imposing immediate losses elsewhere. Slower expansion forces direct choices among constituencies, sectors, and strategic objectives. Geopolitical competition therefore becomes more persistent because distributional conflict moves closer to the center of economic policy
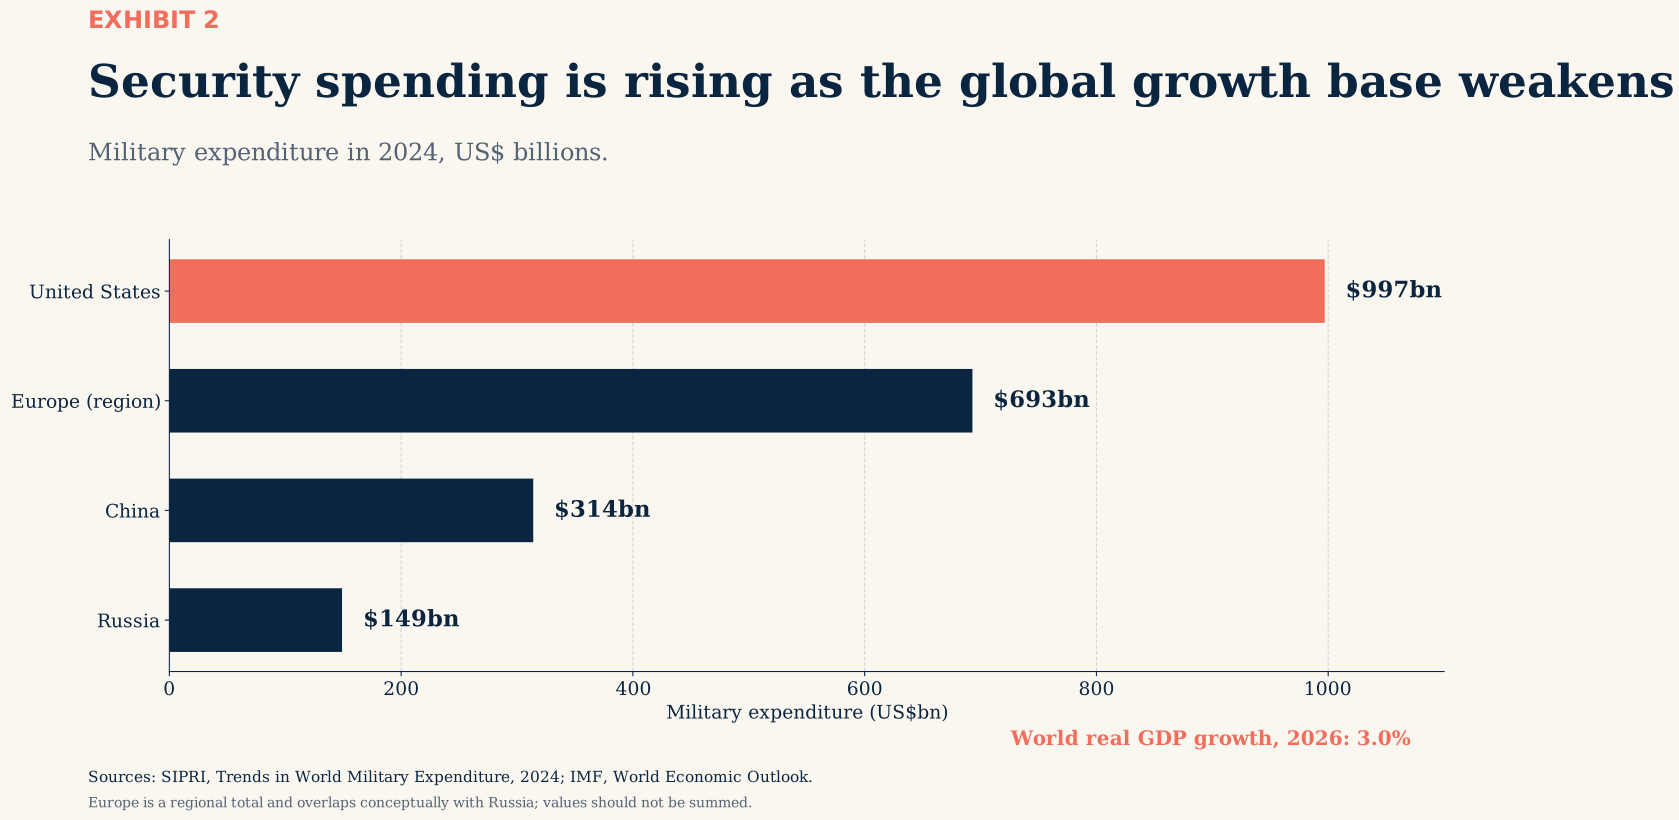
The most consequential divergence on the ledger is the widening gap between economic growth and military expenditure. Global military spending reached $2.71 trillion in 2024, the highest level ever recorded. The United States accounted for $997 billion, equal to 36.8% of the global total. China officially spent $314 billion, although external estimates suggest a materially higher figure after accounting for off-budget activity and differences in domestic purchasing power.47 Russia increased military expenditure by 38% in a single year to $149 billion, equivalent to approximately 6% of GDP.8 European governments are moving in the same direction, with Germany spending $75.6 billion and Poland $22.1 billion.4 These figures are most revealing when placed beside the growth data.
The world is generating less incremental economic capacity while directing more of that capacity toward defense and security. This represents a structural reallocation of resources. During the faster-growth era, defense buildups could be absorbed without placing immediate pressure on the rest of the state. Under slower growth, every additional dollar allocated to deterrence, rearmament, or force modernization competes more directly with social spending, tax relief, public investment, and debt stabilization. The resulting form of power politics is fiscally brittle. Governments are confronting a more demanding security environment with weaker growth, heavier debt burdens, and limited public tolerance for sacrifice. The decisive question is therefore no longer how much a state spends in absolute terms. It is how long that spending can be sustained without degrading the economic base on which military power ultimately depends.
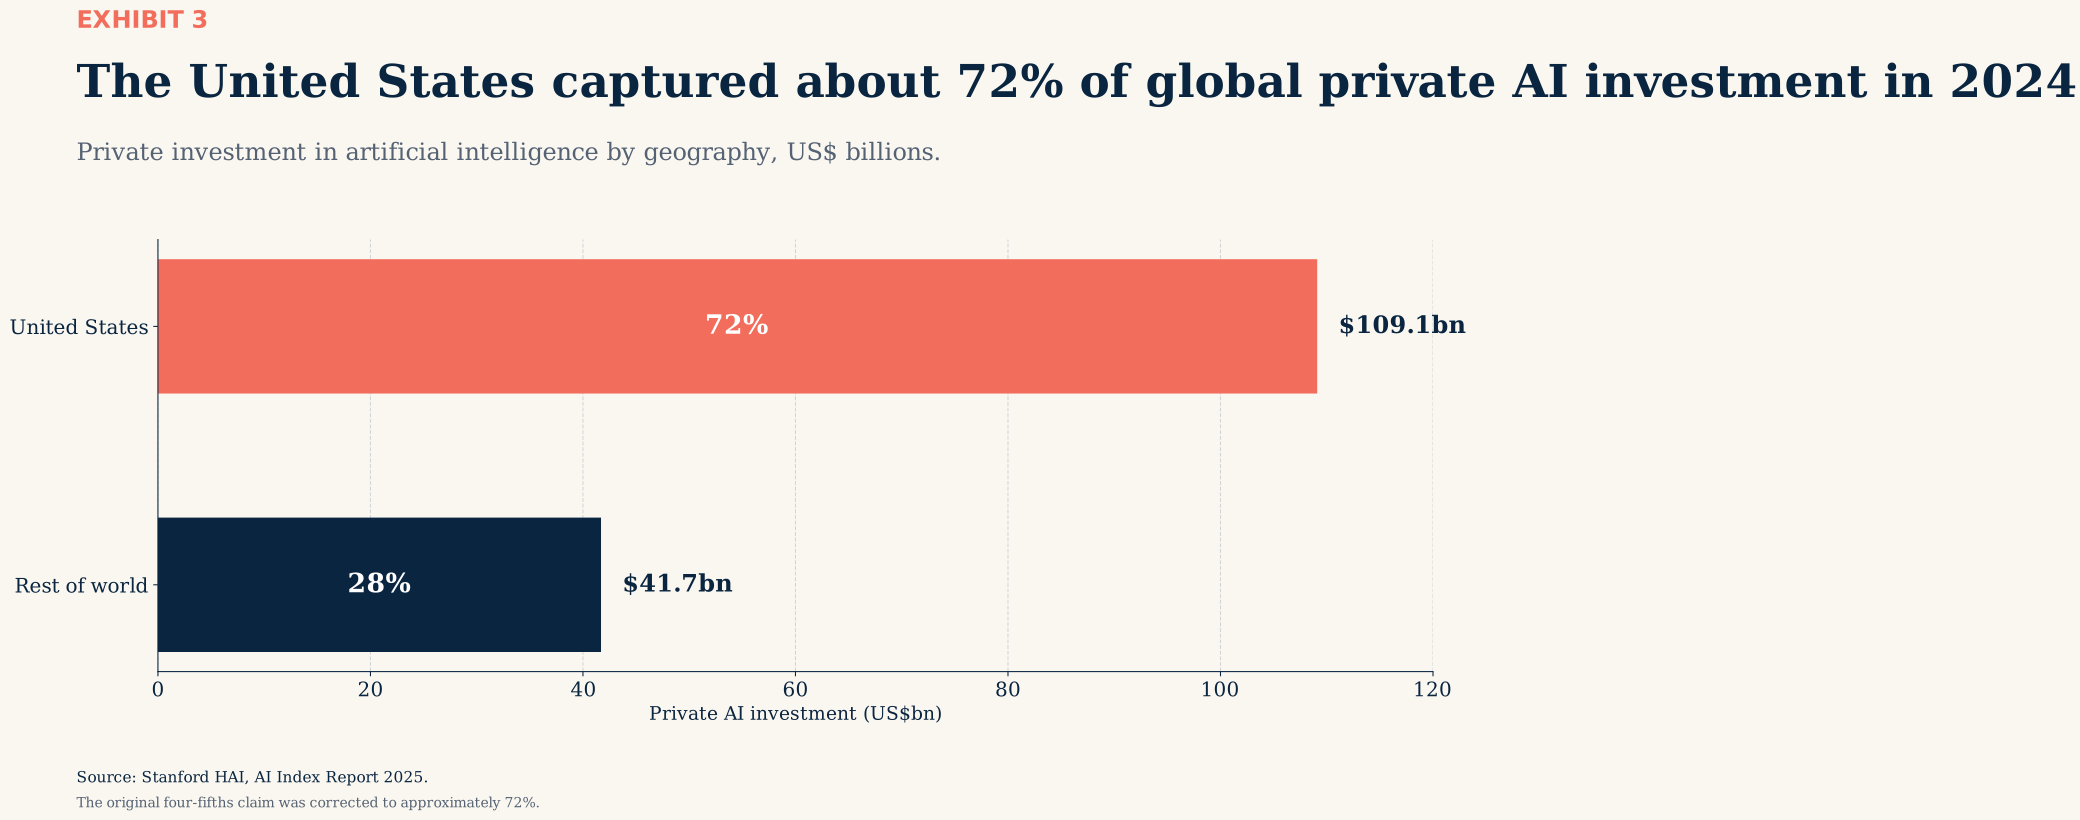
The twentieth century measured power through steel, oil, industrial capacity, and nuclear weapons. The twenty-first increasingly measures it through compute. This is an allocation reality. In 2024, private AI investment in the United States reached approximately $109 billion, equal to roughly 72% of the global total. China attracted $9.3 billion.5 Since 2013, the United States has accumulated more than $470 billion in private AI investment, compared with approximately $50 billion across the European Union.5 The United States also holds a substantial lead in AI-related computing capacity, estimated at roughly nine times China’s and seventeen times the European Union’s.9
These gaps constitute structural asymmetries. In many areas of economic and military power, competition is tightening. In compute, the leading systems are still pulling away. The significance extends well beyond the technology sector. Advanced AI is an upstream capability with effects across productivity, defense, cyber operations, intelligence, scientific discovery, logistics, and industrial organization. It shapes the rate at which firms and states can learn, automate, experiment, and allocate resources. The central constraint is therefore the full compute stack: advanced chips, data centers, electricity, cooling, capital, technical talent, and the institutions capable of coordinating them at scale. States that control more of this stack possess a compounding advantage. They can translate capital into models, models into applications, and applications into economic and strategic capacity.
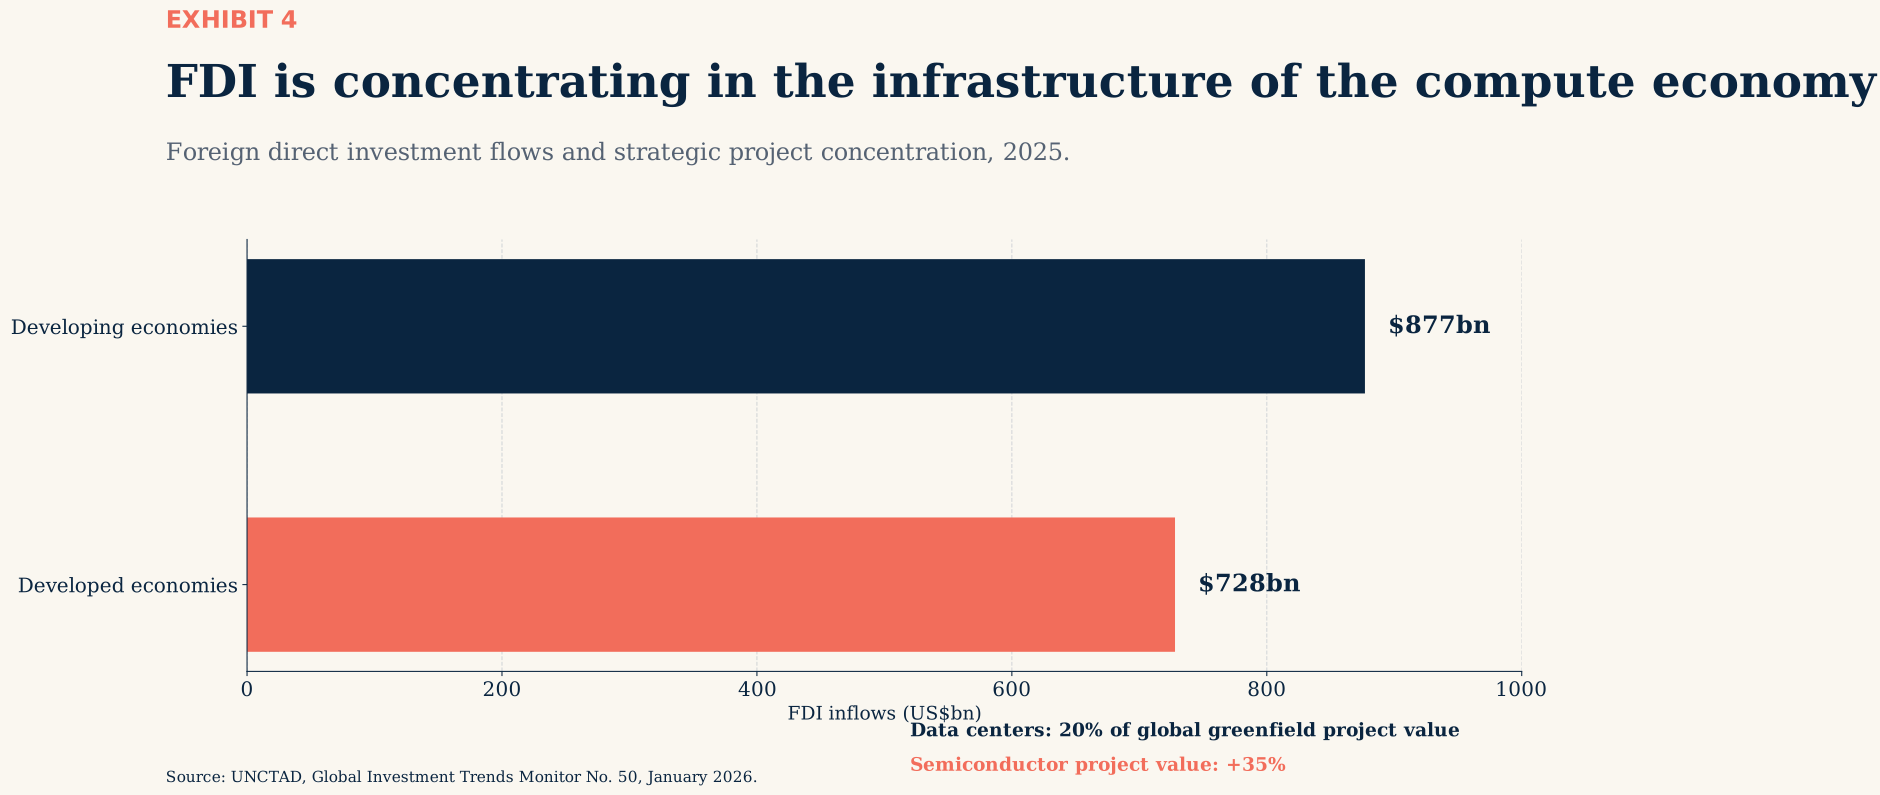
The ledger also records where capital chooses to locate. Cross-border investment provides one of the clearest market assessments of future opportunity and institutional trust. Global foreign direct investment rose 14% in 2025 to $1.6 trillion.6 The distribution of those flows is more important than the aggregate increase. Investment in developed economies rose 43% to $728 billion, while flows to developing economies declined 2% to $877 billion.6 Data centers accounted for more than one-fifth of announced global greenfield project value, while the value of semiconductor projects increased 35%.6 The pattern reflects a shift in the geography of investment.
Capital is increasingly directed toward jurisdictions that combine market scale, legal predictability, energy capacity, digital infrastructure, and reliable access to advanced technology. The compute economy rewards systems that can make large projects executable. The United States remains the principal beneficiary of this allocation. Its fiscal position is deteriorating, with federal debt reaching $38.86 trillion in March 2026 and rising by approximately $7.23 billion a day.10 Yet the United States continues to combine reserve-currency status, deep capital markets, strong legal protections, entrepreneurial depth, and a widening lead in AI infrastructure.
Political stability is among the least visible assets on the ledger. It is also among the most consequential because it determines whether other assets can compound over time. Coface’s global political risk index reached a record 41.1% in 2025.11 Sixty-one countries are now classified as highly or extremely fragile. Together, they contain 2.1 billion people and a disproportionate share of the world’s extreme poverty.12
Instability spreads through the economic system. It weakens tax collection, raises borrowing costs, accelerates capital flight, pushes out skilled workers, deters long-term investment, and degrades logistics. Each effect reduces the capacity of the state to respond to the others. Stable systems receive a premium across multiple channels. They borrow more cheaply, attract longer-duration capital, retain talent, execute infrastructure projects more reliably, and sustain policy commitments across electoral cycles. Switzerland ranked first in the 2025 IMD World Competitiveness Ranking with a perfect score.13 Singapore, Denmark, and Norway express the same underlying mechanism through different institutional models. Stability is therefore a productive asset. It supports the repeated coordination required for investment, innovation, and institutional learning.
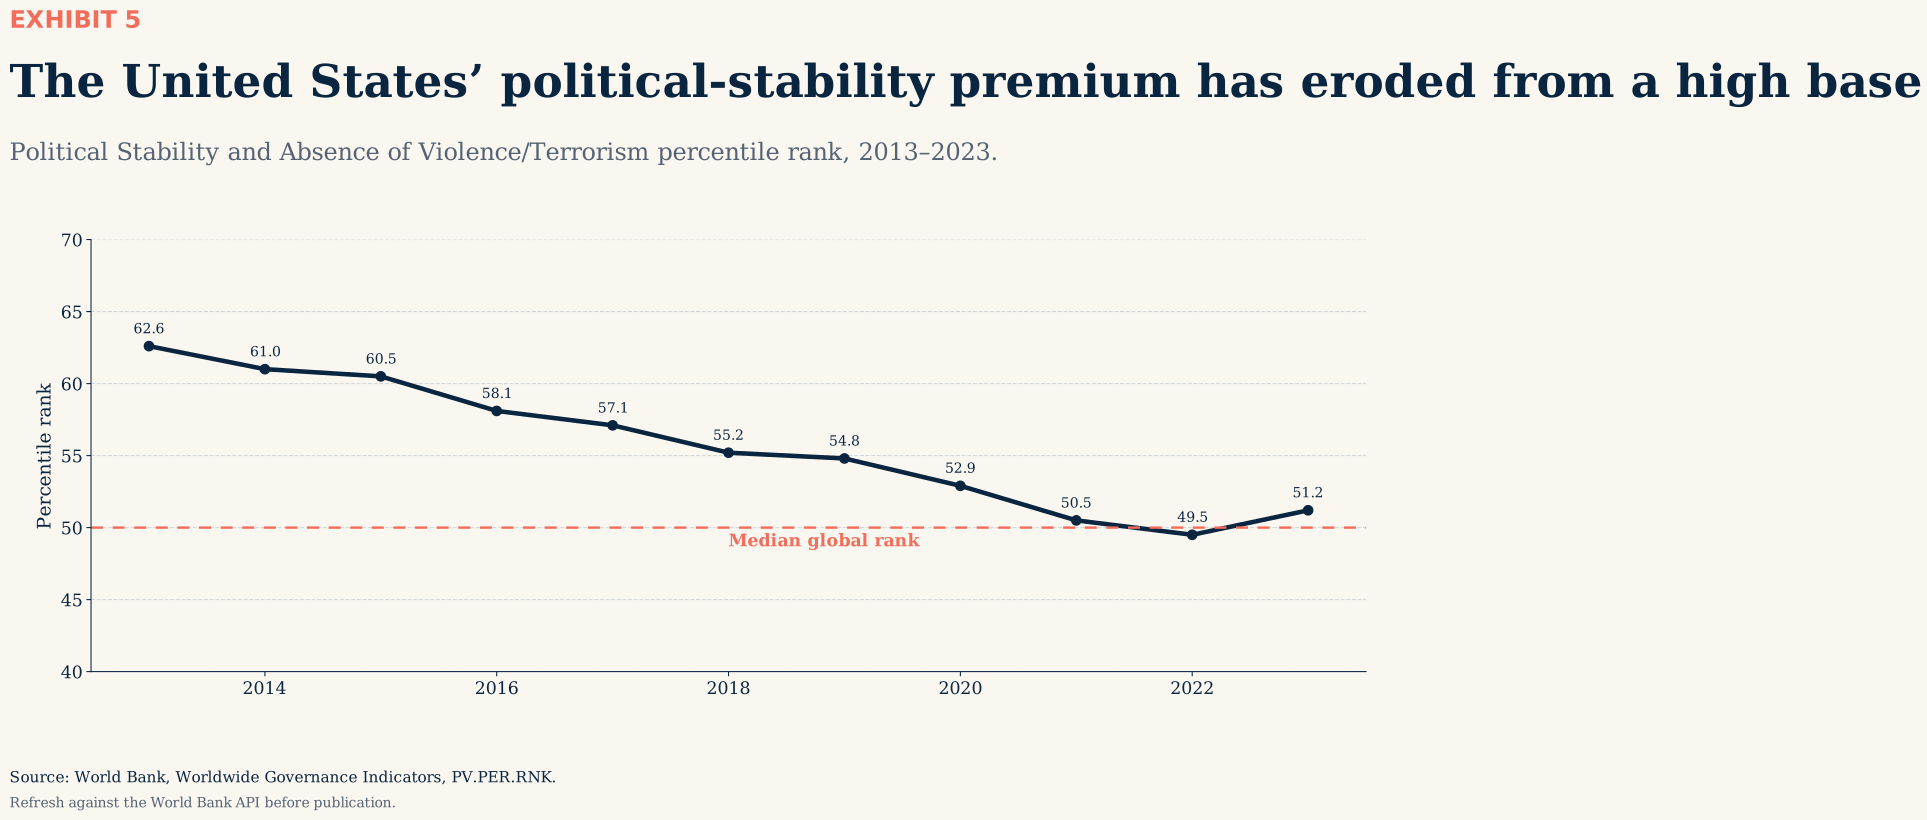
The U.S. position has become more complicated. The United States remains far more stable than the world’s fragile states, yet its performance has deteriorated relative to its own historical standard. The World Bank’s political-stability percentile rank for the United States has fallen from roughly the 60th percentile to around the global median over the past decade.14 The economic consequence lies in the direction of travel. A country with deep institutional reserves can absorb substantial deterioration before a crisis becomes visible. It can also lose part of its compounding premium long before conventional measures register systemic failure.
The ledger yields clear judgments, though none is unconditional.
The United States remains ahead in the aggregate. It possesses the world’s largest economy, deepest capital markets, dominant reserve currency, strongest alliance network, and the most advantaged position in AI infrastructure.510 These assets reinforce one another and remain exceptionally difficult to replicate.
The liabilities are substantial. Federal debt has reached $38.86 trillion, the fiscal deficit is projected at approximately $1.9 trillion in 2026, and institutional wear is weakening the credibility that supports the rest of the ledger.101415
Continued U.S. leadership remains the base case. Its durability depends on whether fiscal and institutional liabilities can be contained before they erode the capital-market, alliance, and innovation advantages that sustain the system.
China is gaining selectively. It is expanding naval capacity, missile inventories, manufacturing scale, battery production, renewable-energy deployment, and control over critical industrial supply chains at extraordinary speed.7 In specific geographic theatres, these concentrated capabilities can matter more than aggregate national wealth.
China also carries a heavy and opaque liability structure. Demographic decline, property-sector losses, inefficient capital allocation, weak household demand, declining foreign confidence, and a large compute gap constrain its ability to convert industrial gains into durable system-wide advantage.916
China’s strength lies in concentration and execution. Its vulnerability lies in the economic and institutional costs required to sustain them.
Europe remains rich, educated, institutionally deep, and commercially powerful. It contains the world’s largest integrated market and retains significant advantages in advanced manufacturing, regulation, research, and human capital.
Its central weakness is allocation. Europe has drawn down the post-Cold War peace dividend without replacing it with sufficient investment in defense readiness, energy resilience, digital infrastructure, and AI capacity. Its assets remain considerable, but its strategic conversion rate is too low.
Europe’s challenge is therefore organizational. It must turn fragmented national resources into continental capability at a speed its current institutions rarely achieve.
Russia is spending down its ledger.
Wartime mobilization has raised measured output and industrial activity in the near term. That output is being generated through the accelerated use of labor, savings, capital stock, fiscal reserves, and future optionality.8
This model can sustain military activity for longer than many external observers once expected. It cannot generate broad-based economic compounding. Russia is financing present coercive capacity through the liquidation of future productive capacity.
| Actor | Ledger verdict | Primary constraint |
|---|---|---|
| United States | Retains the strongest combined position in capital markets, alliances, technology, and compute | Debt accumulation and institutional erosion |
| China | Gaining rapidly in manufacturing, military concentration, and industrial scale | Demography, opacity, inefficient allocation, and the compute gap |
| Europe | Wealthy and capable, with substantial latent strategic power | Slow conversion of economic assets into defense and technological capability |
| Russia | Sustaining wartime production through accelerated consumption of national assets | A high-burn economic model with declining future capacity |
Three consequences follow from this shift in the arithmetic.
In a world growing near 2.5%, strategic rivalry becomes increasingly distributive. Market access, export controls, industrial subsidies, shipping routes, energy supplies, technology standards, and access to capital matter more because the margin for policy error is smaller.
The return of tariff politics and strategic trade reflects this structural condition. Relative position carries greater weight when aggregate growth provides less compensation to the sectors, regions, and countries that lose.
Economic scale remains important, but its strategic value depends on conversion. The same dollar produces very different outcomes depending on whether it funds productive infrastructure, human capital, technology, patronage, consumption, or delay.
A slower-growth world rewards systems that allocate capital effectively and penalizes systems that confuse expenditure with capability. This principle applies to military budgets, AI investment, industrial policy, energy systems, and corporate capital expenditure.
The decisive measure is the conversion rate from resources to durable capacity.
Debt, entitlement obligations, and rising interest costs have moved from the background of economic policy into the center of national strategy.1517 They determine how much fiscal room governments retain when the external environment deteriorates.
A state with weak fiscal capacity has fewer options during war, recession, financial stress, or technological disruption. It must tax more, borrow at higher cost, cut other priorities, or accept a narrower strategic objective.
The framework also applies below the level of the state. Firms carry ledgers of their own. The strongest organizations continue allocating into capability, resilience, and learning while weaker competitors rely on revenue scale as evidence of durability.
The ledger is universal. The units change.
These themes will be shaped by a limited number of variables.
| Signal | Why it matters |
|---|---|
| Underlying world growth | Growth settling near 2.5% would intensify distributional pressures and strengthen the competitive logic described here. A sustained return above 3.5% would provide governments with greater fiscal and political flexibility. |
| Defense burden relative to nominal growth | Absolute spending reveals scale. The more important measure is whether security commitments are rising faster than the economic and fiscal base required to sustain them. |
| The compute stack | Private AI investment, data-center construction, electricity availability, export controls, advanced-chip access, and model-training capacity will show whether the U.S. advantage is widening or narrowing. |
| Cross-border capital flows | A sustained decline in U.S. inward investment, or a durable recovery in foreign investment into China, would indicate a shift in relative confidence among the major economic systems. |
| Institutional stability | Political-stability measures, central-bank independence, tariff volatility, fiscal credibility, and financing conditions will reveal whether the stability premium in advanced economies is holding. |
The central question is which systems can continue converting economic power into military capacity, technological leadership, and investable stability as growth slows and trade-offs become harder.
The global economy has moved into an era of strategic competition. In this environment, resilience and strength belong to the system with durable assets, manageable liabilities, and capacity to convert one into the other.
Call it the arithmetic of power.