Reports
Loading reports …
Fetching the current index of long-form research.
Fetching the current index of long-form research.
U.S. fiscal risk is shifting from the debt stock to the refinancing channel.
The United States is not facing an imminent funding cliff. It is entering a more durable and more important fiscal regime: one in which the price of continuous financing becomes a central budget constraint. The debt stock sets the scale of the problem, but the refinancing channel sets the pressure. Old low-coupon liabilities are maturing into a higher-rate Treasury market while primary deficits keep adding supply. In that regime, auction absorption, maturity composition, term premium, and buyer composition stop being market plumbing. They become fiscal variables.
CBO’s baseline now places the market-facing federal debt stock in historically rare territory. Debt held by the public is projected to rise from 101 percent of GDP in fiscal year 2026 to 120 percent in 2036, above the previous 1946 peak of 106 percent. The deficit is projected to remain large throughout the decade, rising from 5.8 percent of GDP in 2026 to 6.7 percent in 2036. CBO states plainly that rising net interest costs drive much of that increase. The issue, therefore, is not only the size of the debt. It is the recurring process by which that debt must be refinanced, priced, absorbed, and carried through the federal budget.
The budget effect has already arrived. BEA data show federal government interest payments running at $1.219 trillion at a seasonally adjusted annual rate in Q1 2026, equal to roughly 15.9 percent of federal current expenditures on the same national-accounts basis. This is not the same concept as CBO net interest outlays, but the signal is the same: interest has become one of the central claims on federal cash flow. On CBO’s budget basis, net outlays for interest are projected to rise to $2.1 trillion in 2036, or 4.6 percent of GDP.
The United States still has extraordinary financing advantages. The Treasury market remains the world’s deepest sovereign debt market. The dollar remains the dominant reserve, collateral, and settlement currency. Domestic institutions need Treasuries for liquidity and regulatory purposes, and global investors need them for reserve management, hedging, and dollar liquidity. But those advantages operate through price, maturity, and buyer composition. They do not repeal the budget constraint. They determine how slowly, smoothly, and expensively the constraint binds.
The interest state is the fiscal structure that emerges when past borrowing becomes a rising current expenditure and future policy ambitions must clear the refinancing calendar. It is not a prediction of default. It is a diagnosis of constraint.
| Indicator | Latest reading used here | Why it matters |
|---|---|---|
| Total public debt outstanding | $39.071 trillion on May 21, 2026 | Establishes the scale of the stock, including intragovernmental holdings. |
| Debt held by the public | $31.375 trillion on May 21, 2026 | The market-facing stock that must be financed outside federal trust-account transactions. |
| BEA federal interest payments | $1.219 trillion SAAR in Q1 2026 | Shows the national-accounts run rate of federal interest payments. |
| CBO debt projection | 120 percent of GDP in 2036 | Places the public debt ratio above the prior 1946 high. |
| Treasury Q3 borrowing estimate | $671 billion in privately held net marketable borrowing | Shows that financing has become a recurring macro event rather than a background operation. |
| 10-year / 30-year Treasury par yields | 4.53 percent / 5.01 percent on June 9, 2026 | Shows the market rate environment into which new coupon issuance must clear. |
The debt debate becomes confused when different fiscal concepts are used interchangeably. This report uses four distinctions.
First, total public debt outstanding is not the same as debt held by the public. Total public debt includes intragovernmental holdings, such as Treasury securities held by federal trust funds and other government accounts. Debt held by the public is the market-facing stock held by investors, institutions, foreign official holders, the Federal Reserve, and other entities outside the federal government’s internal accounts. For market absorption and refinancing pressure, debt held by the public is the more important measure.
Second, BEA federal government interest payments are not the same as CBO net interest outlays. BEA reports interest payments in the national income and product accounts. CBO reports net interest in the federal budget, after accounting for interest receipts and federal budget conventions. The two series should not be mixed, but both measure the same broad regime shift: interest has become a major federal claim.
Third, a seasonally adjusted annual rate, or SAAR, annualizes quarterly data after adjusting for seasonal patterns. A $1.219 trillion SAAR interest-payment reading in Q1 2026 does not mean the federal government paid exactly $1.219 trillion in that quarter. It means the quarterly rate, after seasonal adjustment, would equal $1.219 trillion if sustained for a full year.
Fourth, Treasury’s privately held net marketable borrowing excludes certain rollovers of securities held in the Federal Reserve’s System Open Market Account, or SOMA, while including financing required by SOMA redemptions. The measure is designed to capture the net marketable debt Treasury must place with private investors.
The standard debt-dynamics equation is simple:
Change in debt-to-GDP ≈ primary deficit + [(average interest rate − nominal GDP growth) × debt stock]
More formally, when the debt ratio is measured as debt divided by GDP:
Δd ≈ p + [(r − g) / (1 + g)] × d
In this expression, d is the debt-to-GDP ratio, p is the primary deficit as a share of GDP, r is the average nominal interest rate on the debt stock, and g is nominal GDP growth. The primary deficit is the deficit excluding interest payments.
The equation clarifies the regime change. High debt is easier to manage when nominal growth exceeds the average interest rate and the primary deficit is small. It becomes harder to stabilize when the average interest rate rises, nominal growth slows, or the primary deficit remains large. The United States does not need a sudden market revolt for fiscal space to narrow. A persistent gap between borrowing needs and the cost of rolling the debt is enough.
The U.S. debt debate often begins with the headline number because the headline number is now enormous. Treasury’s Debt to the Penny data show total public debt outstanding at $39.071 trillion on May 21, 2026. Of that amount, $31.375 trillion was debt held by the public and $7.696 trillion was intragovernmental holdings. The publicly held piece is the key market-facing measure because it is the stock that must be financed outside the federal government’s own accounts.1
CBO’s baseline places that market-facing stock in historically rare territory. In its February 2026 Budget and Economic Outlook, CBO projected debt held by the public at 101 percent of GDP in fiscal year 2026 and 120 percent in 2036. That path exceeds the previous postwar peak of 106 percent in 1946.2FRED’s latest official quarterly debt-to-GDP series ends at Q4 2025, with public debt held by the public at 98.2 percent of GDP. BEA reported nominal GDP at $31.856 trillion annualized in Q1 2026, while Treasury reported debt held by the public above $31.3 trillion by late May. The 100 percent line is therefore no longer a distant threshold. It is the operating zone.3
That threshold matters, but it can also mislead. The United States has carried high debt before. The more important difference is the surrounding fiscal regime. After World War II, debt was high, but the economy demobilized, nominal growth was strong, and the federal government moved toward much smaller primary deficits. In the 2026 baseline, CBO expects the federal deficit to remain large throughout the projection period. The deficit is 5.8 percent of GDP in 2026 and rises to 6.7 percent in 2036, compared with a 50-year average of 3.8 percent. CBO attributes much of that increase to rising net interest costs.4
The debt stock is therefore the inherited condition. The current stress comes from flow. A large stock can remain manageable when new borrowing is limited and the average rate on the stock is low. It becomes a budget machine when the government must refinance at higher rates while adding new debt every year.
That is the interest state: a fiscal structure in which past borrowing becomes a growing current expenditure, and in which the annual budget is shaped by the market terms on debt issued years earlier.
EXHIBIT 1
Debt Held by the Public Has Reentered the Postwar Zone
Public debt held by the public, percent of GDP, historical FRED series with CBO baseline projection.
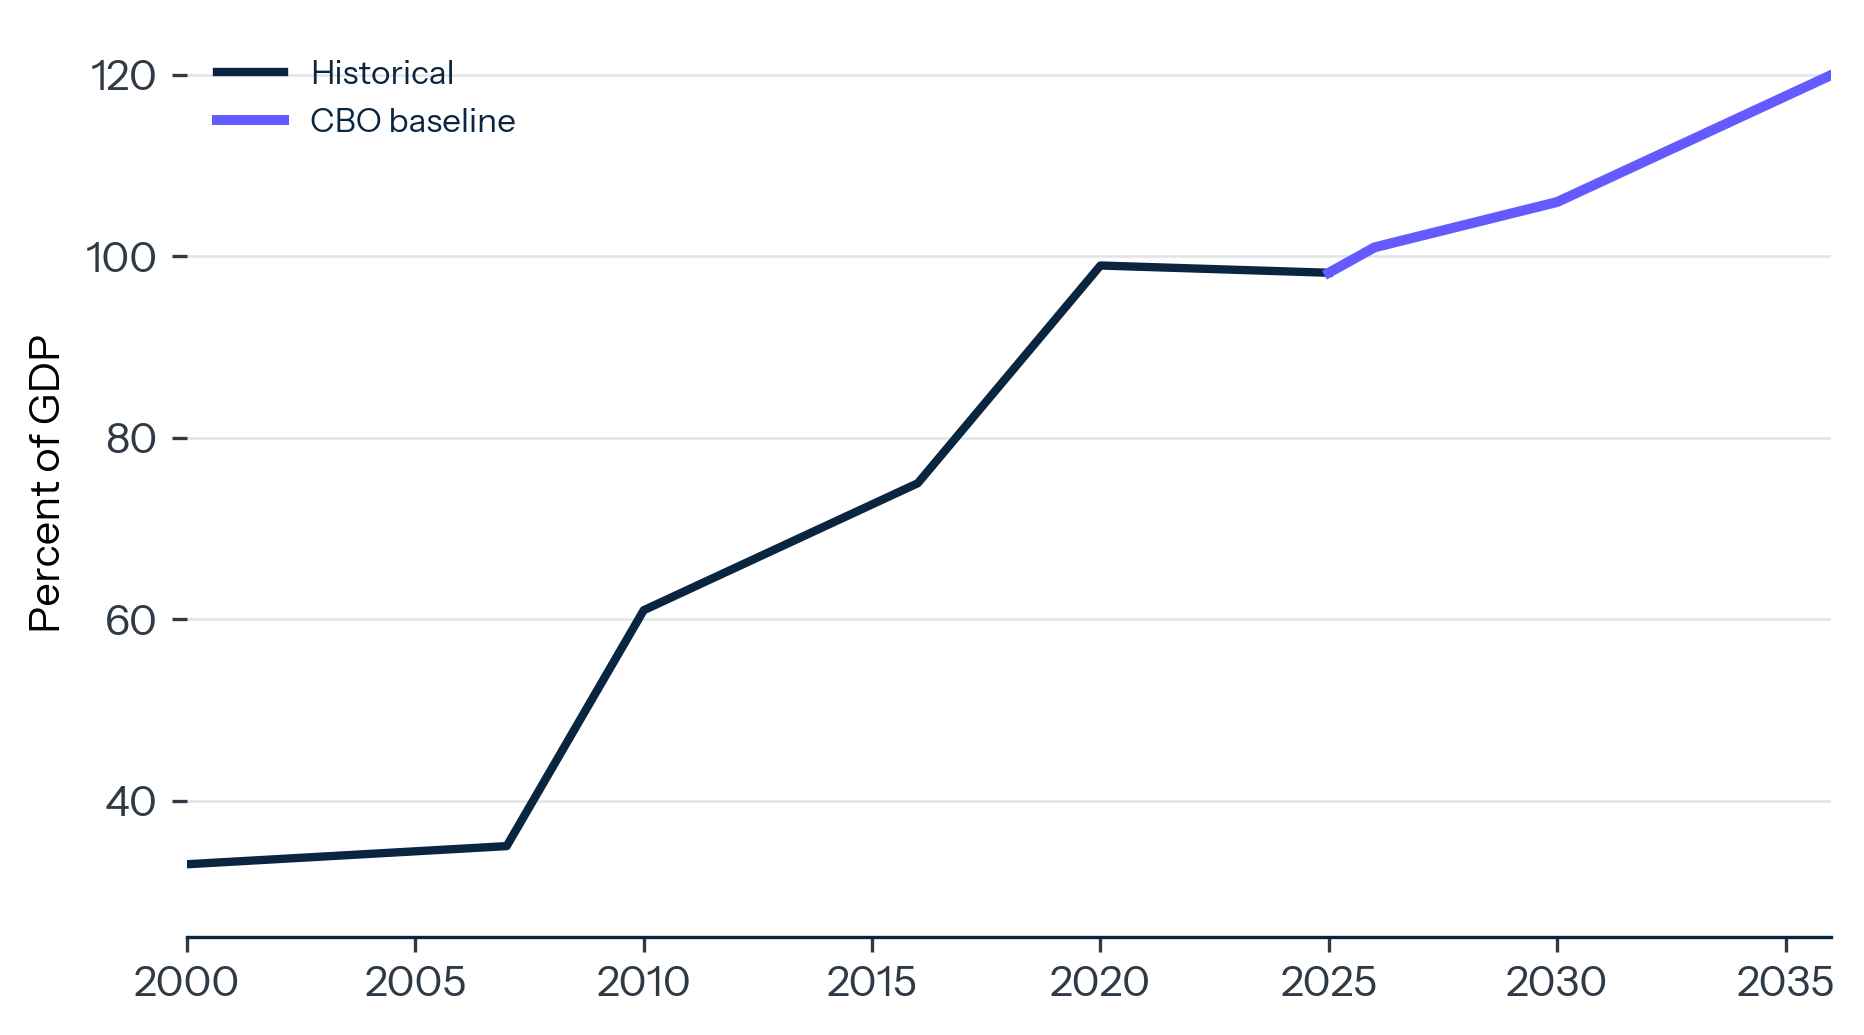
Source: Federal Reserve Bank of St. Louis, FYGFGDQ188S; Congressional Budget Office, The Budget and Economic Outlook: 2026 to 2036, February 11, 2026.
Interest costs rise through two channels. The first is volume: more debt requires more financing even if rates are unchanged. The second is price: as old securities mature, Treasury replaces them at current market rates. This second channel is the coupon reset. It can move slowly because the Treasury has a large maturity ladder, but it becomes relentless when higher rates persist.
The reset is visible in the gap between the average rate on outstanding debt and the market rate on new issuance. Treasury’s average interest rate data show the total average rate on interest-bearing debt at 3.340 percent on April 30, 2026. The average rate on total marketable debt was 3.373 percent. Bills averaged 3.696 percent, notes 3.230 percent, bonds 3.403 percent, and floating-rate notes 3.764 percent. By May 31, the average rate on total marketable debt had edged up to 3.386 percent.5
Those averages remain well below the current long-end borrowing environment. Treasury’s daily par yield curve showed the 10-year at 4.53 percent and the 30-year at 5.01 percent on June 9, 2026.6The gap is the fiscal legacy of the low-rate era. The debt stock still carries coupons issued under earlier conditions. As those securities mature, the average cost of the stock moves toward the market rate at which new securities must clear.
BEA’s current-expenditure data show the budget effect. Federal government interest payments reached $1.219 trillion at a seasonally adjusted annual rate in Q1 2026. One year earlier, the same series stood at $1.144 trillion. Total federal current expenditures were $7.679 trillion annualized in Q1 2026, which means interest payments were roughly 15.9 percent of that BEA current-expenditure measure.7
This is not a claim that BEA interest payments equal CBO net interest outlays. They are different measures. The point is more basic: on both national-accounts and federal-budget measures, interest has become a major federal cash claim.
EXHIBIT 2
The Interest Bill Is Now a Trillion-Dollar Run Rate
Federal government current expenditures: interest payments, seasonally adjusted annual rate.
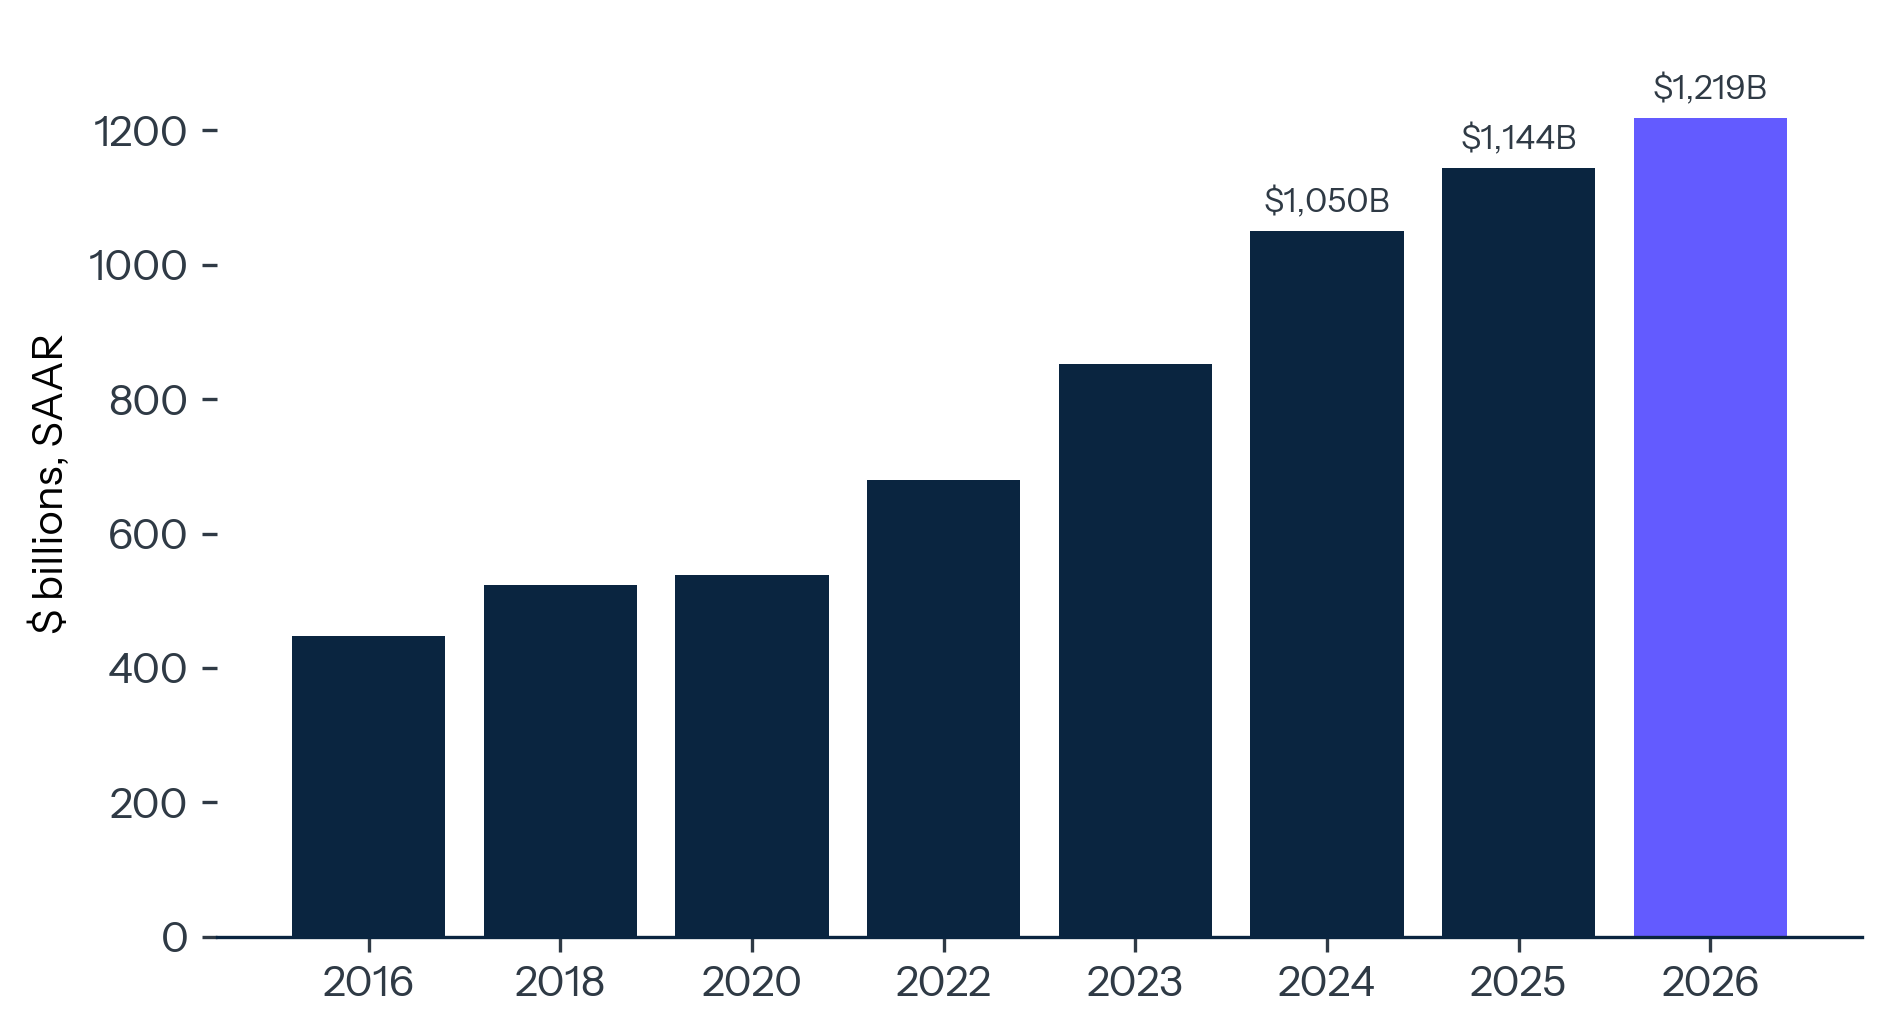
Source: Bureau of Economic Analysis via FRED, A091RC1Q027SBEA.
The coupon reset changes the meaning of future deficits. When rates are low and debt service is contained, an additional deficit dollar is mainly a question of distribution, demand, or investment quality. When the average rate is rising, the same dollar also creates a future debt-service claim. That claim depends on the maturity structure of issuance and on the market’s willingness to absorb duration without demanding a higher term premium.
EXHIBIT 3
The Coupon Reset Is Still Passing Through
Average interest rates on Treasury securities by class compared with current 10-year and 30-year Treasury par yields.
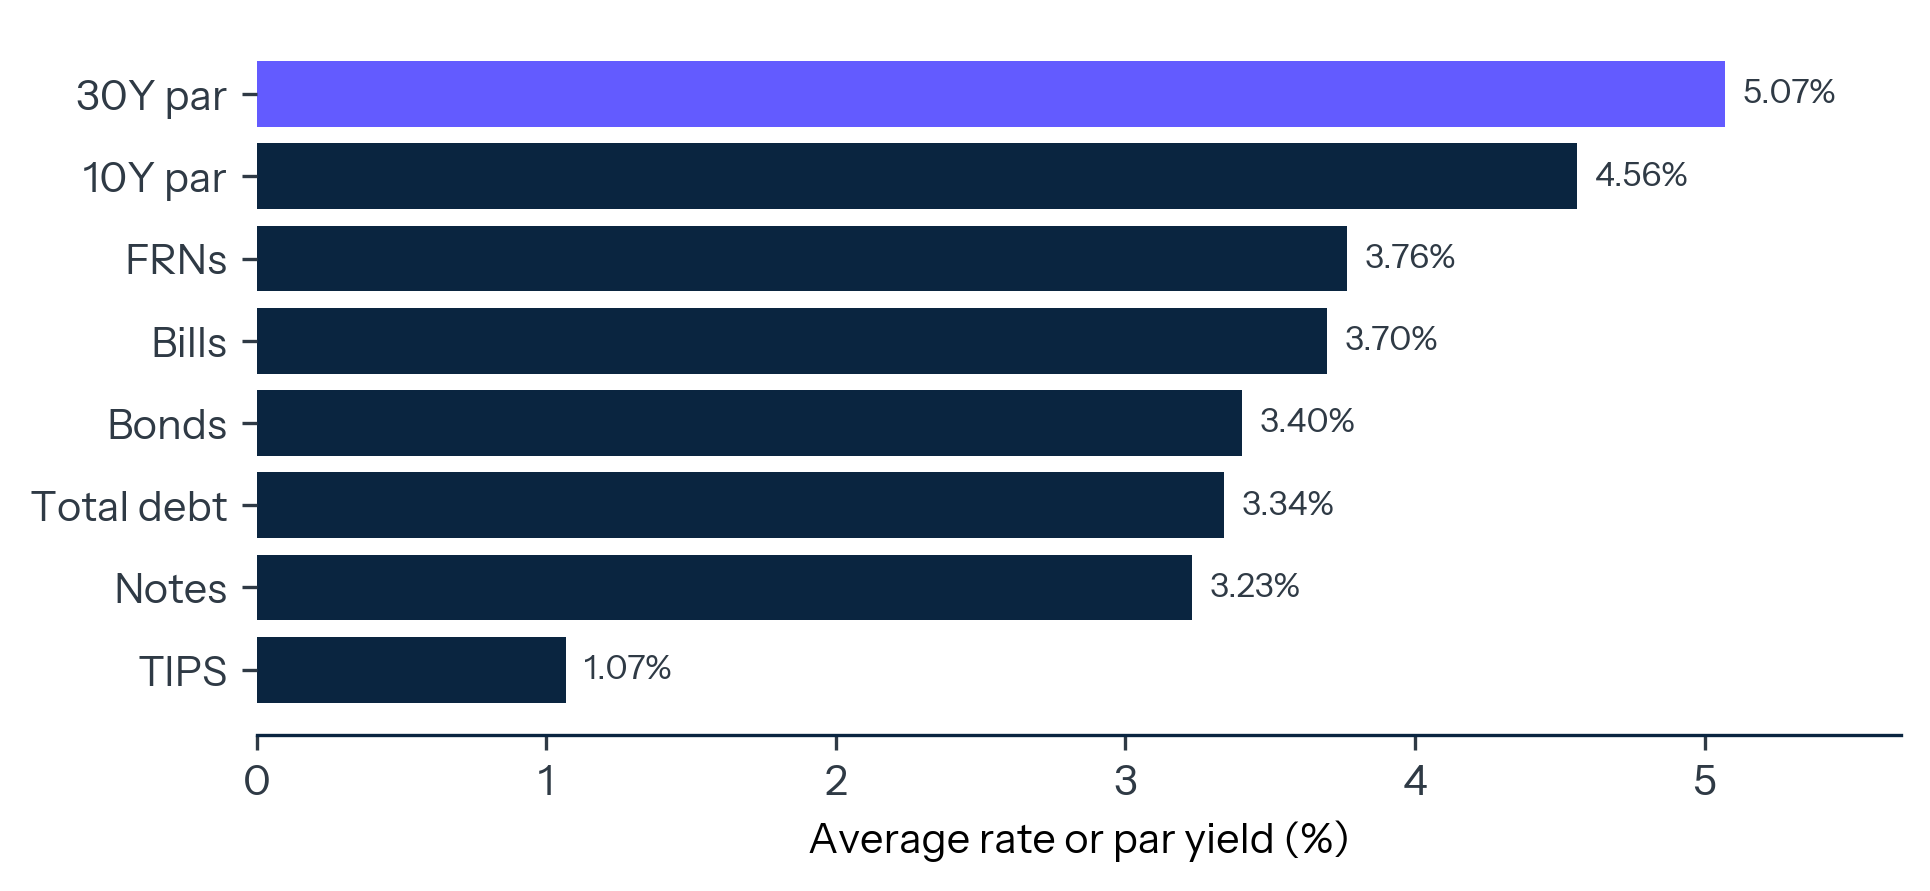
Source: U.S. Treasury Fiscal Data, Average Interest Rates on U.S. Treasury Securities; U.S. Treasury Daily Treasury Par Yield Curve Rates.
A rough sensitivity calculation shows the scale. A 100-basis-point increase in the average cost of the $31.375 trillion market-facing debt stock would eventually imply about $314 billion of additional annual interest cost once fully reflected in the stock. A basis point is one-hundredth of a percentage point. The timing is not instantaneous because maturities roll over gradually, and the budget measure would differ from the gross calculation. But the magnitude explains why refinancing terms now matter at the center of the fiscal debate.
EXHIBIT 4
Small Rate Changes Become Large Budget Claims
| Average-rate increase on debt held by the public | Approximate eventual annual run-rate cost | Interpretation |
|---|---|---|
| 50 basis points | $157 billion | Comparable to a major federal program line. |
| 100 basis points | $314 billion | Large enough to reshape fiscal negotiations. |
| 150 basis points | $471 billion | A structural claim on future budget space. |
Note: Illustrative full-stock calculation using $31.375 trillion of debt held by the public on May 21, 2026. It does not represent the first-year budget effect, excludes interest receipts, and does not model maturity timing or policy feedback.
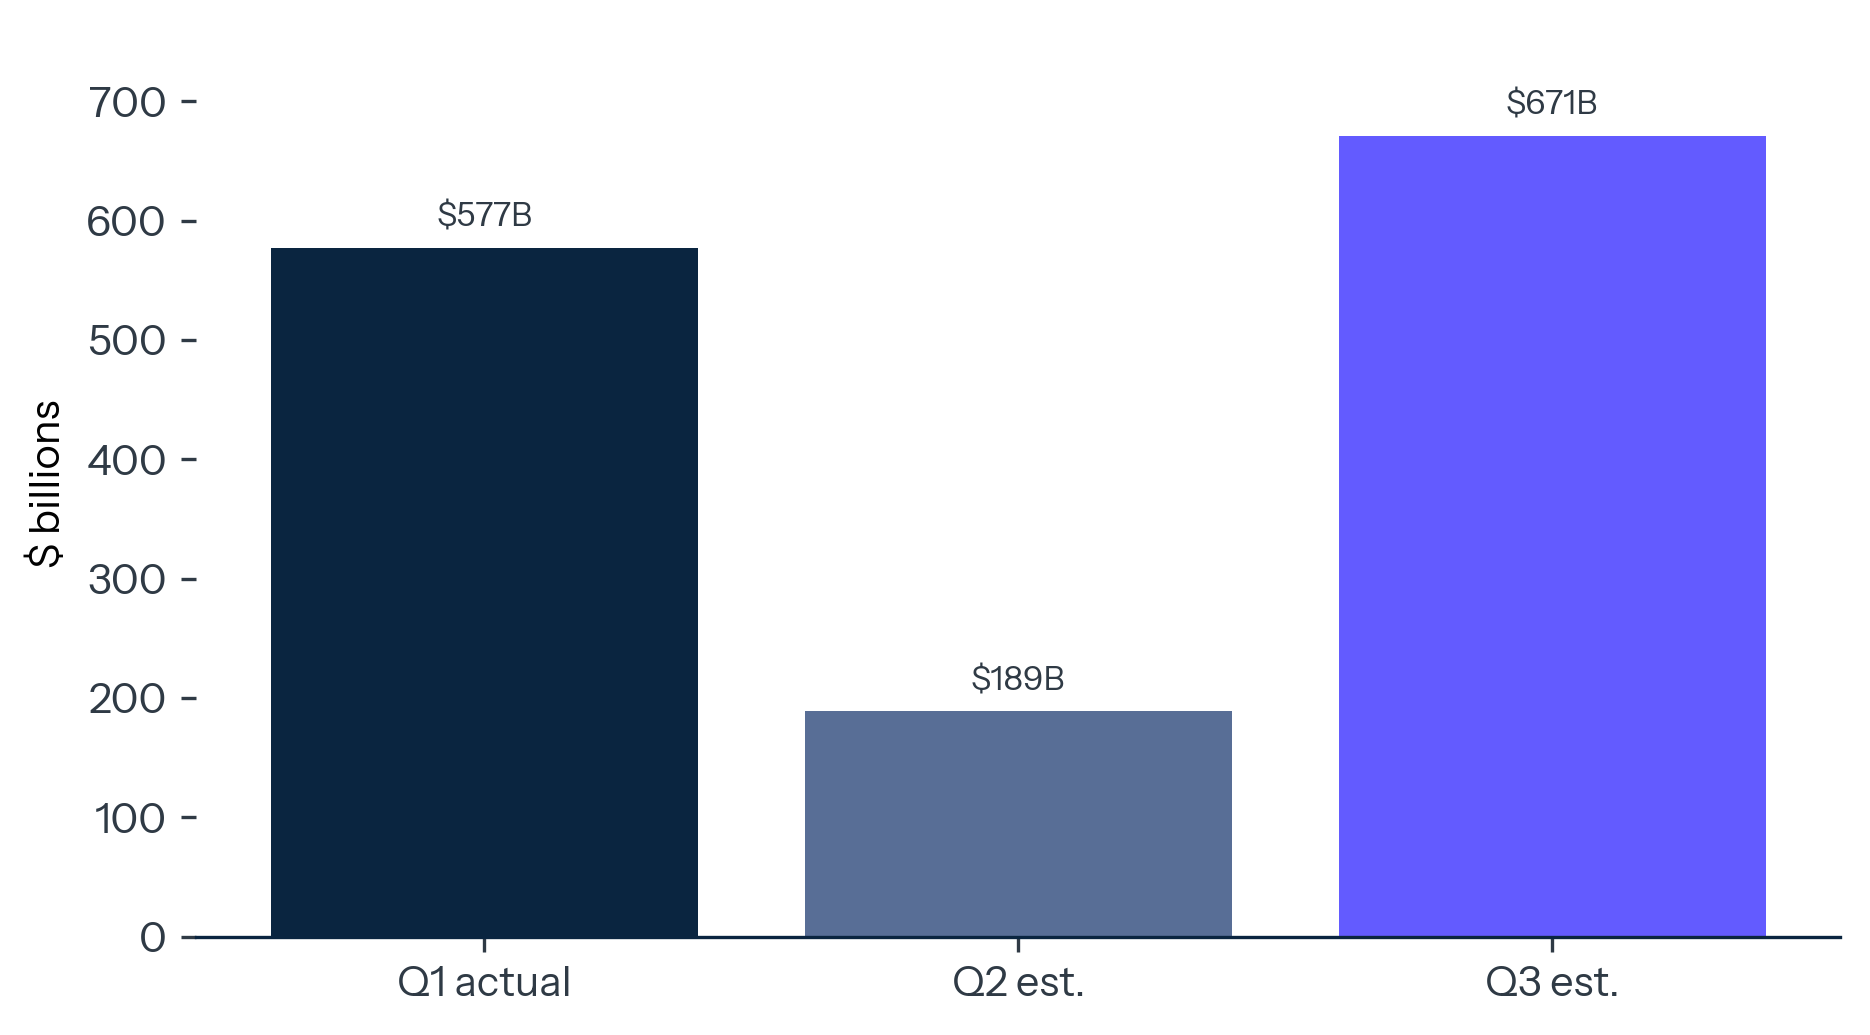
Treasury financing has become one of the most important recurring macro releases in the world. The May 4, 2026 borrowing estimate showed why. Treasury said it expected to borrow $189 billion in privately held net marketable debt during the April–June 2026 quarter, assuming a $900 billion end-of-June cash balance. It expected to borrow $671 billion during the July–September quarter, assuming a $950 billion end-of-September cash balance. In the January–March quarter, Treasury borrowed $577 billion and ended with an $893 billion cash balance.8
Those figures matter even when the market absorbs them smoothly. The Treasury market remains the world’s benchmark risk-free market, but the scale of issuance means quarterly borrowing plans influence reserves, money-market positioning, bill supply, coupon duration, and term-premium risk. This is the operational side of the interest state. The fiscal path is transmitted through auctions, cash-balance assumptions, bill-size adjustments, refunding decisions, and the maturity mix.
The May 6, 2026 quarterly refunding statement gave the process a concrete form. Treasury offered $125 billion of securities to refund approximately $83.3 billion of privately held Treasury notes maturing on May 15, 2026. The operation raised approximately $41.7 billion of new cash from private investors. The package included a $58 billion 3-year note, a $42 billion 10-year note, and a $25 billion 30-year bond.9
That is the refinancing channel in miniature. Maturing securities are replaced. New cash is raised. The maturity mix becomes a policy variable. Treasury also said it expected to maintain nominal coupon and floating-rate note auction sizes for at least the next several quarters, while continuing to evaluate future increases in nominal coupon and floating-rate note auction sizes. It pointed specifically to structural demand and to the costs and risks of different issuance profiles.10
EXHIBIT 5
Borrowing Has Become a Standing Quarterly Macro Event
Privately held net marketable borrowing: Q1 2026 actual and Treasury estimates for Q2 and Q3 2026.
Source: U.S. Treasury, Marketable Borrowing Estimates, May 4, 2026.
The key point is institutional, not merely numerical. Large deficits require issuance. Issuance choices affect market pricing. Market pricing feeds back into future interest costs. The budget process then inherits the cost of past market conditions. The loop can operate quietly, but it shifts power toward the refinancing calendar.
Interest is politically different from most federal spending because it is the cost of commitments already made. Congress can change future tax policy, benefit formulas, discretionary appropriations, procurement plans, and grant programs. Debt service arrives from accumulated obligations and prevailing market rates. It behaves like a hard budget claim even though it is analytically distinct from entitlement spending.
CBO’s 2026 baseline captures the shift. Federal outlays are projected at $7.4 trillion in 2026, or 23.3 percent of GDP, and 24.4 percent of GDP in 2036. CBO attributes the increase to greater spending on Social Security and Medicare and growth in net interest costs, partly offset by declining discretionary outlays. Revenues are projected at $5.6 trillion, or 17.5 percent of GDP, in 2026 and 17.8 percent in 2036.11
The implication is direct. If revenues remain around 17 to 18 percent of GDP while outlays remain above 23 percent, the difference must be financed. If the difference is financed at higher average rates, debt service grows. As debt service grows, the primary adjustment needed to stabilize the debt becomes larger because policymakers must offset both the noninterest deficit and the interest burden.
This is why the interest state is a political-economy story, not just an accounting story. It changes the structure of every future budget. Defense expansion, industrial policy, AI infrastructure, energy security, border enforcement, health care, Social Security, disaster relief, and tax cuts all compete inside a budget where a growing claim has no electoral constituency but automatic priority. Interest is the payment no party campaigns for, yet it is the one line that cannot be skipped without turning a fiscal problem into a credit event.
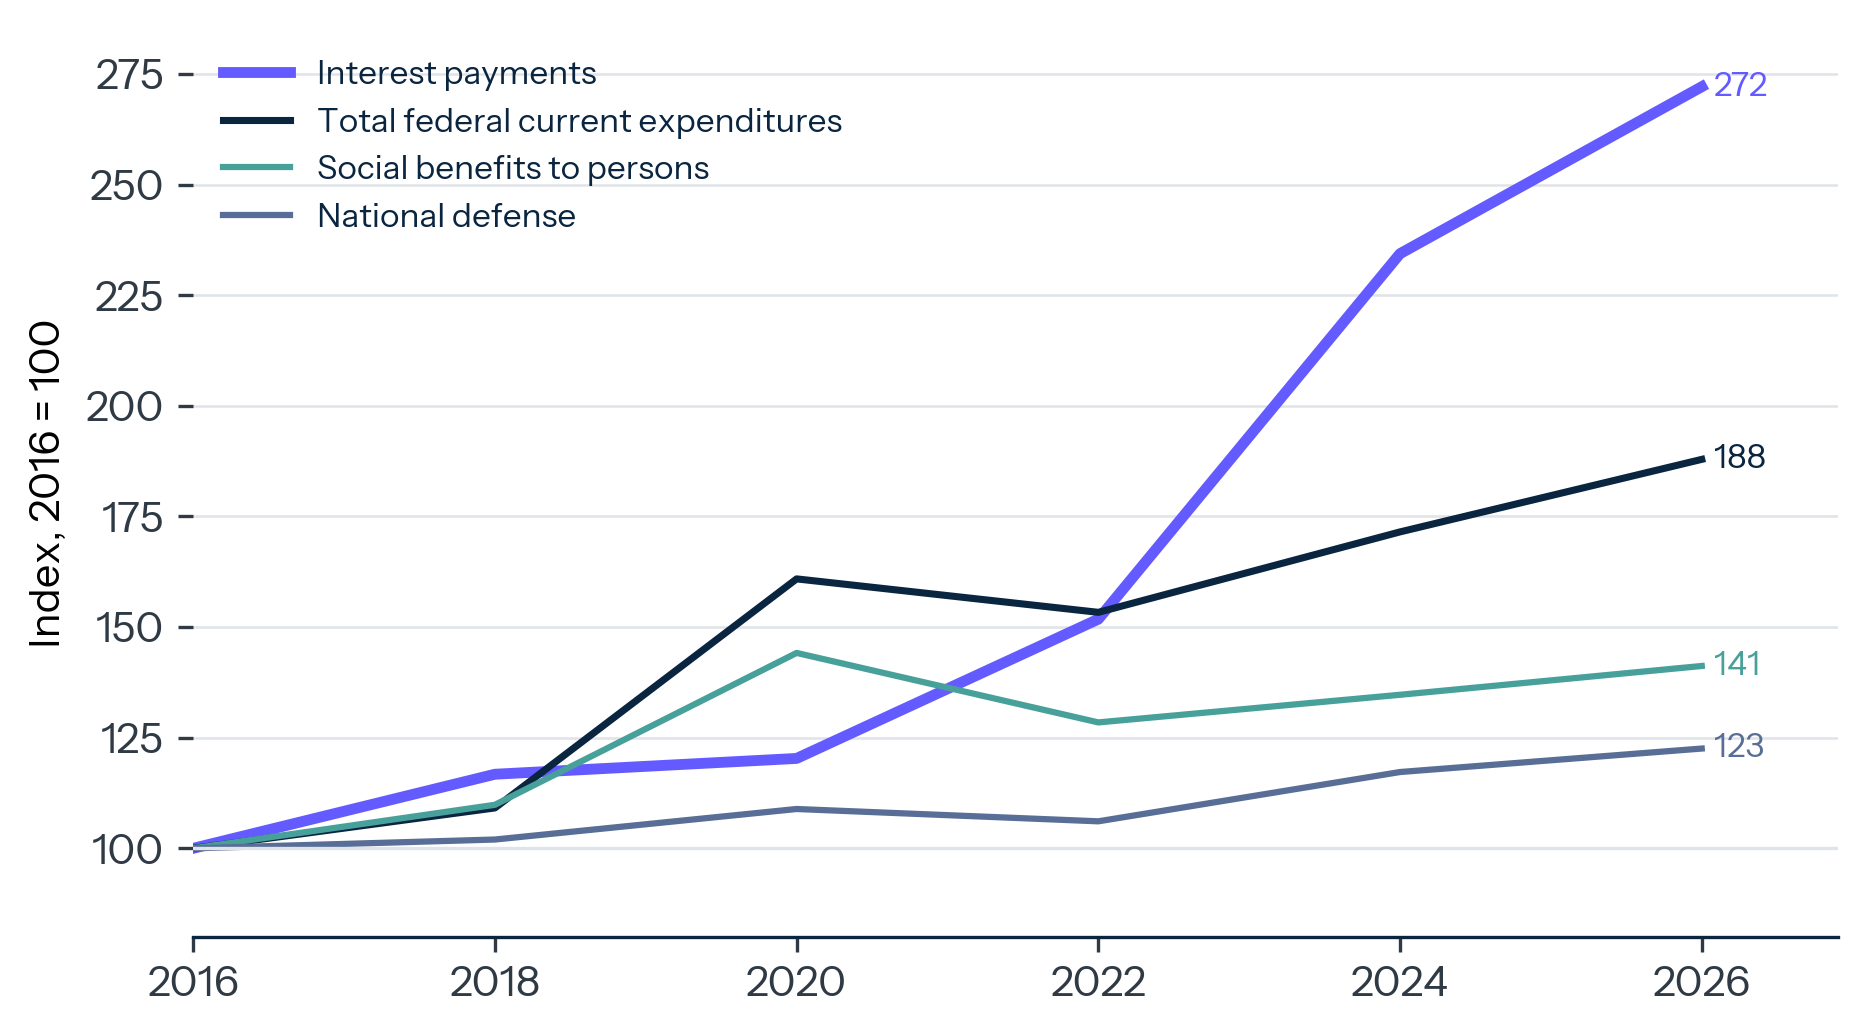
EXHIBIT 6
Debt Service Is Moving Toward the Budget Center
Federal interest payments compared with major federal spending categories, using a consistent source basis and clearly separating BEA national-accounts measures from CBO budget outlays.
Source: Bureau of Economic Analysis via FRED; Congressional Budget Office.
The correct interpretation remains disciplined. The United States is a sovereign issuer of the world’s reserve currency. Its debt is the core collateral of the global financial system. Those facts explain why adjustment can be slow and market-mediated. They change the form of the budget constraint without removing it.
The United States still has a buyer base no other sovereign can match. Domestic institutions need Treasuries for liquidity and regulation. Global investors need them for reserve management, collateral, and dollar liquidity. The Federal Reserve can affect the reserve and maturity environment through its balance sheet. Foreign private investors and official institutions remain deeply involved in the market.
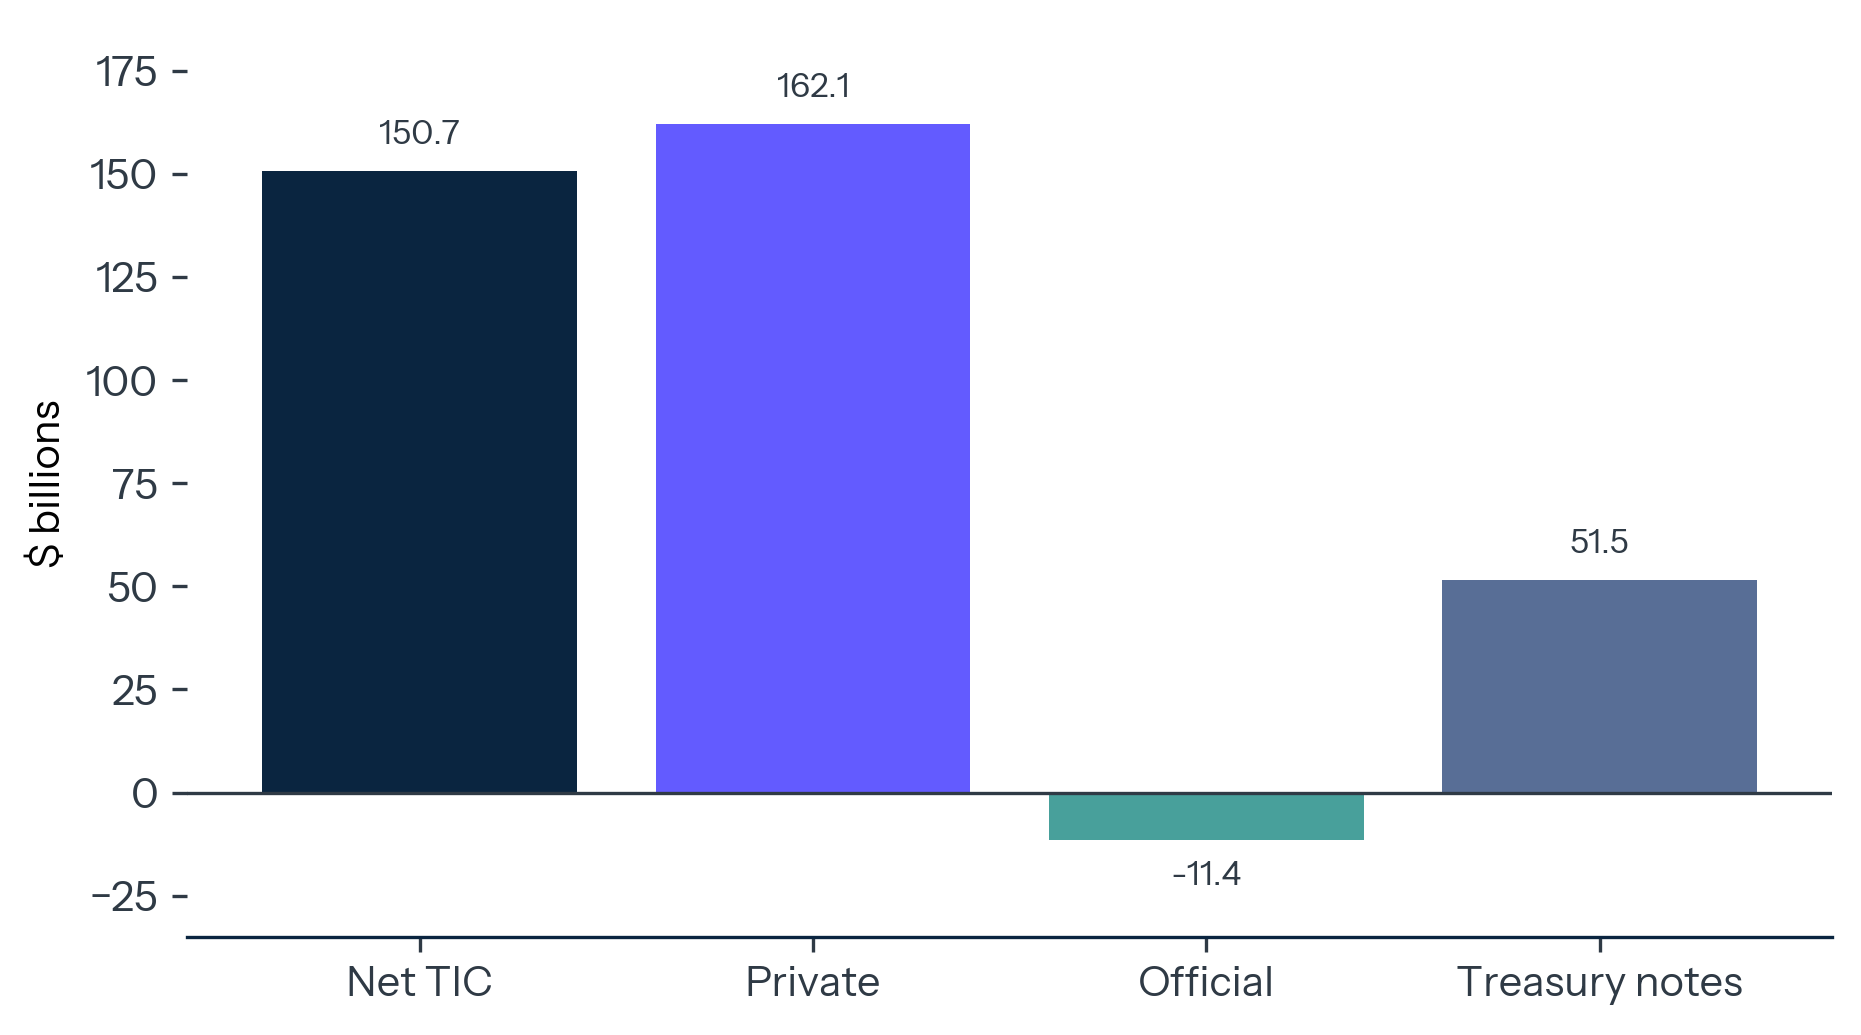
The March 2026 Treasury International Capital release confirms that demand remains broad, while also showing why composition matters. Treasury reported a net TIC inflow of $150.7 billion in March. Net foreign private inflows were $162.1 billion, while net foreign official flows were outflows of $11.4 billion. Foreign residents made $96.5 billion of net purchases of long-term U.S. securities. Private foreign investors purchased $111.4 billion of long-term U.S. securities net, while foreign official institutions sold $14.9 billion net.12
That mix matters because private demand is generally more price-sensitive than official reserve accumulation. Official institutions buy Treasuries for currency management, liquidity, and reserve safety. Private buyers buy them for yield, hedged return, relative value, collateral, and portfolio construction. A buyer base that is large but more private-led can clear supply, but the clearing price can move.
Treasury’s TIC release also cautions against over-interpreting country-level custody data. Securities held in third countries may obscure true ownership, and custodial data do not capture every foreign dollar asset position. That caveat is important because monthly TIC tables are often converted too quickly into geopolitical narratives. The stronger conclusion is simpler: the United States has buyers, but those buyers are being asked to absorb large net issuance, refinancing supply, and duration risk while the fiscal burden becomes more visible.13
EXHIBIT 7
The Marginal Buyer Is Still There, but More Price-Sensitive
Grouped bars showing March 2026 TIC private inflows, official outflows, long-term securities purchases, and Treasury bill flows.
Source: U.S. Treasury, Treasury International Capital Data for March 2026, released May 18, 2026.
The market signal to watch is the cost of clearing. Higher term premium, larger auction tails, heavier reliance on bills, weaker official demand, and faster average-rate drift would all indicate that the interest state is tightening. These are market-structure signals. They will likely appear before the political system agrees on a fiscal diagnosis.
A serious fiscal argument must face the best objections.
The first objection is that the dollar system gives the United States an unmatched financing privilege. That is true. The Treasury market’s depth, legal infrastructure, repo-market centrality, and collateral role make it fundamentally different from ordinary sovereign debt markets. But privilege operates through better financing terms, not through exemption from arithmetic. The question is not whether the United States can borrow. It is how much fiscal space is consumed by the price of doing so.
The second objection is that rates can fall. That is also true. A decline in short rates would reduce bill and floating-rate note costs more quickly. A decline in long rates would ease future coupon issuance. But the average coupon would fall with the same lag that now makes it rise gradually. Lower rates would slow the pressure; they would not by themselves resolve a baseline in which primary deficits remain large.
The third objection is that faster productivity growth could outgrow the debt. This is the most constructive upside case. Stronger real growth, especially from durable productivity gains, would raise GDP and revenues. CBO itself discusses the possibility that generative AI could lift productivity growth more than expected. But faster growth can also raise interest rates, and CBO’s own sensitivity discussion notes that stronger growth scenarios can come with higher interest outlays. Growth helps most when it is accompanied by primary-deficit reduction, not when every revenue gain is immediately capitalized into new commitments.14
The fourth objection is Japan. Japan shows that a sovereign can carry very high debt for a long time without a market crisis. It does not show that debt has no cost. Japan’s experience is embedded in a different domestic savings structure, central-bank balance-sheet regime, inflation history, currency role, and growth profile. The relevant lesson is not complacency. It is that high debt can persist through financial repression, low returns, central-bank balance-sheet expansion, and institutional adaptation. Those are constraints by another name.
The fifth objection is that Treasury can manage the maturity structure. Yes, and it should. But maturity management shifts risks; it does not eliminate them. More bills can reduce near-term cost when the front end is favorable, but it raises rollover exposure to short-rate changes. More coupons lock in funding for longer, but require the market to absorb more duration. Floating-rate notes can diversify demand, but increase exposure to short-rate movements. Debt management can improve the path through the interest state. It cannot make the path disappear.
The thesis would weaken if four conditions emerged together: the primary deficit fell materially, nominal GDP growth stayed persistently above the average interest rate on federal debt, long-end Treasury yields declined without a deterioration in inflation credibility, and auction demand remained strong without higher term premia or growing reliance on short bills. Any one of those developments would help. Together, they would mean the coupon reset was being absorbed without a major fiscal trade-off.
The thesis would strengthen if the opposite occurred: the average rate on the stock continued to drift higher, bill issuance rose to avoid duration absorption, foreign official demand weakened on a trend basis, auction tails widened, or CBO’s baseline deteriorated after legislative changes. The most important signal is not a single failed auction or a dramatic market break. It is a slow rise in the price required to clear an otherwise functioning market.
Rates matter more than growth slogans. Faster productivity growth would help, and AI-driven productivity upside deserves attention. But the fiscal path is already sensitive to the relationship among nominal growth, primary deficits, and the average interest rate on the debt stock. If growth improves while deficits remain large and rates stay elevated, the fiscal benefit is diluted by higher debt service.
The Fed–Treasury boundary becomes harder to manage. The Federal Reserve sets monetary policy for inflation and employment. Treasury manages issuance for cost and risk over time. In the interest state, those mandates interact more visibly. Short-rate cuts can reduce bill costs and floating-rate costs. Long-rate increases can raise future coupon costs. Balance-sheet policy can alter reserves, SOMA redemptions, and the maturity profile that private investors must absorb. The institutions remain separate, but markets price the combined effect.
Fiscal capacity becomes more selective. The United States can still borrow, invest, and mobilize resources. The issue is the opportunity cost of doing so when debt service is already a central budget claim. Every strategic ambition now sits next to a refinancing schedule. Defense modernization, AI infrastructure, energy security, disaster adaptation, and entitlement promises all face the same background fact: past borrowing has become a current competitor.
Political delay has a measurable price. Delay allows more securities to roll at current rates and more deficits to add to the stock. Fiscal adjustment becomes harder when interest has compounded into the baseline. The menu narrows unless policymakers combine revenue, spending, growth, and debt-management choices before markets demand harsher terms.
The first indicator is the average interest rate on total interest-bearing Treasury debt. Treasury publishes it monthly, and it is the cleanest direct measure of the coupon reset moving through the stock. A continued rise would mean the low-rate legacy is still being replaced by more expensive debt.
The second indicator is the Treasury borrowing and refunding mix. Bill issuance can meet financing needs quickly and often cheaply, but it increases exposure to short-rate changes. Coupon issuance locks in funding for longer but asks the market to absorb more duration. Changes in auction sizes, cash management bill use, buybacks, and floating-rate note issuance will reveal how Treasury balances near-term cost against refinancing risk.
The third indicator is net interest as a share of revenues and outlays. This is where the debt issue becomes a budget issue. When interest absorbs a rising share of receipts, policymakers need larger primary adjustments to stabilize the debt path.
The fourth indicator is the foreign official and private split in TIC. One month of official outflows is too little evidence for a trend, and TIC custody data have known attribution limits. A persistent private-led financing mix, however, would make Treasury supply more dependent on yield-sensitive buyers.
The fifth indicator is long-end market pricing. The 10-year and 30-year Treasury yields, term-premium estimates, auction tails, bid-to-cover ratios, dealer awards, and indirect bidder participation will show whether investors require additional compensation for fiscal supply. The signal to watch is a higher clearing cost that slowly migrates into the federal interest bill.
The United States still has buyers for Treasuries. It still has the world’s reserve currency, the deepest sovereign debt market, and unusual institutional capacity. Those strengths make a sudden funding crisis unlikely. They also make gradual fiscal deterioration easier to ignore.
The interest state is not a collapse scenario. It is a constraint scenario. The debt stock is large enough that small changes in average funding cost have large budget effects. The deficit is persistent enough that issuance remains a standing macro event. The maturity structure is important enough that debt management has become fiscal policy by other means. The buyer base is deep enough to clear supply, but price-sensitive enough that clearing terms matter.
The fiscal debate should therefore move from the headline debt number to the refinancing channel. The question is no longer simply how much the United States owes. It is how often the stock must be repriced, at what rate, through which maturities, and with which buyers. That is where the next phase of U.S. fiscal politics will be decided.
