Loading reports … Fetching the current index of long-form research.
Reports
Loading reports … Fetching the current index of long-form research.
Office conversion can create housing. Cities still need to know what their incentives buy, and who keeps the value they add.
Cities should price office-conversion incentives, tie each to a named outcome, and track process intensively. New York has an independent estimate for its exemption, while the City’s own ledger records 467-m as a new program without a cost estimate. Washington sets an amount for each downtown award, and publishes none of them.
An office-conversion incentive is a public purchase. The city should know what it buys, what it pays, and who keeps the difference.
New York’s Comptroller has priced the 467-m exemption for office conversions at $5.1 billion in present value across the Manhattan pipeline that could qualify. The Department of Finance’s ledger of tax expenditures carries no estimate for it yet. Washington has awarded ten downtown conversion abatements and published the amount of none of them. Both cities are paying for housing in their business districts, and neither can yet show the price next to what it bought.
The evidence in Sections 2-4 comes mostly from the Comptroller’s July 2025 study of New York conversions. Section 3 uses it to say who pays, Section 4 tests what the cities can show was delivered, and Sections 5 and 6 set out the rule that follows and the tools a city can use.
An empty office building is a candidate for housing, and many candidates fail. Its floor-plate, core, facade, elevators, mechanical systems, light and air, and existing leases decide whether it can be adapted at a cost the market will bear. The law matters separately: New York’s 2023 Office Adaptive Reuse Study found outdated regulations, building eligibility rules, floor-area limits and design requirements to be material constraints.1 A building that clears those tests must still support residential rents and a capital structure willing to finance the change.
A large stock of underused office space therefore yields a much smaller stock of feasible housing. Deep floor-plates and awkward layouts add demolition, cut rentable area, or demand costly light-and-air fixes. Higher rents can make a building viable with no incentive at all, and a lower purchase price can do the same. A lender’s consent, expiring leases, a construction loan, and the timing of approvals each decide whether a candidate becomes a project.
A city needs a price, an outcome and a delivery record before it awards support. Before award, a city needs a dated no-support case for the building, a named outcome the incentive is meant to change, and delivery terms with a fiscal estimate attached. After award, it needs a record that shows whether the outcome arrived. Announcement section sets these out as a protocol for discretionary awards and names the separate levers for New York’s as-of-right exemption.
Repricing opened a conversion path in Manhattan. The exemption then adds value to the building, and the published record cannot show who keeps it.
Conversion economics start with the purchase price. A lower office price cuts the value a residential project must support after construction, financing and a required return, so post-pandemic repricing opened a path that was closed when the same buildings traded higher.
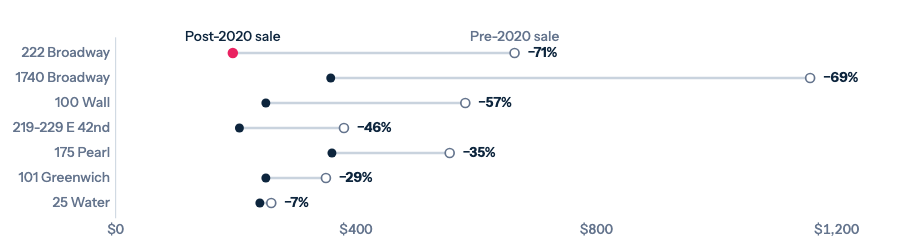
In the Comptroller’s rental-conversion sample, the weighted average price fell from $500 a gross square foot before 2020 to $276 after, a decline of 45 percent. The table covers 23 buildings that converted or were expected to, mixes recorded sales with estimates, and is unadjusted for timing, quality and financing conditions.2 Eight buildings carry a value in both periods. At 750 Third Avenue the later figure is the developer’s own valuation of a land contribution, so Exhibit 1 leaves it out. At 101 Greenwich the later figure is an estimate based on news reports, which the exhibit keeps and labels.
The seven buildings fell by between 7 and 71 percent. At 222 Broadway the price fell furthest, from $664 to $195 a square foot. The sample measures lower purchase prices among conversion candidates. It cannot measure citywide depreciation, and it cannot show how the losses were split between former owners and their lenders; that needs debt and restructuring records.
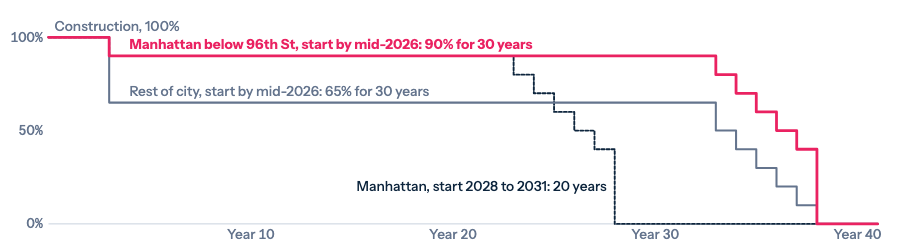
New York’s 467-m exemption was signed on April 20, 2024 as part of the state budget; a thinner version the Governor proposed in January 2023 had failed to pass. It covers commercial buildings converted to rental housing with at least six units that start construction after December 31, 2022 and by June 30, 2031, and finish by December 31, 2039. At least 25 percent of the units must be income-restricted at a weighted average no higher than 80 percent of area median income, with at least 5 percent of all units at 40 percent. The restricted units stay rent-stabilized permanently, and the statute sets no program-wide cap.3
The size of the exemption depends on where and when a project starts. A qualifying building is fully exempt for up to three years of construction. After completion, a building wholly south of 96th Street in Manhattan is 90 percent exempt and a building anywhere else 65 percent. The full-rate period runs 30 years for starts by June 30, 2026, 25 years for starts by June 30, 2028, and 20 years for starts by June 30, 2031, and a five-year phase-out follows.
Weighted by its phase-out, the early Manhattan schedule equals 30 fully exempt years after construction, before discounting. The same start outside the zone equals about 21, and so does a Manhattan start in 2029. The design rewards speed, and it pays one rate across a zone whose economics differ block by block. An owner who breaches the affordability terms faces a penalty tied to the capitalized value of the benefits, capped at 1,000 percent.4
The Comptroller’s stylized model shows the mechanism. It assumes a conversion cost of $500 a gross square foot, excluding the purchase and including financing. In the full-market case, gross income is $75, operating expenses $14, property tax $21, and net operating income $40. Under 467-m, gross income falls to $64 because a quarter of the units are restricted, and property tax falls to $2. The tax saving is $19 and the rent given up is $11, a net gain of $8; the reported net operating income is $49 because the components are rounded.5
That net gain is small against the building’s income and large against its land value. Capitalized at the model’s hurdles, it raises what a buyer can pay from $122 to $250 a gross square foot on a yield-on-cost basis, a gain of $128, and from $168 to $319 on a present-value basis, a gain of $151. The model states its inputs: a 75 percent ratio of rentable to gross area; a unit mix of 56 percent studios, 32 percent one-bedrooms and 12 percent two-bedrooms; market rent of $105 a rentable square foot against $42 for restricted units; 5 percent vacancy on market units; a 6.5 percent yield-on-cost hurdle; and a 5.0 percent exit cap rate with a 7.5 percent discount rate. A higher exit cap rate or a higher conversion cost lowers both residual values.
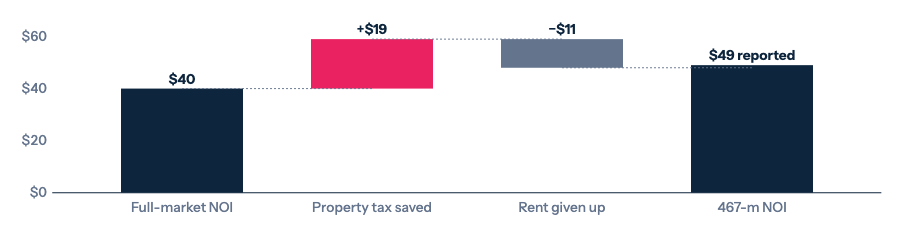
On the yield-on-cost method, the value the exemption adds equals the net income gain divided by the hurdle rate, so conversion cost drops out. At the model’s 6.5 percent hurdle the rounded $8 gain adds about $123 a square foot; the Comptroller’s $128 reflects its unrounded gain of about $8.30. At 6 percent the same gain would add about $139, and at 7.5 percent about $111.
Residual value is the most a buyer can pay, and markets decide how much of it the seller collects. Part III takes up that question with the program-wide numbers.
The exemption buys a quarter of each building’s units at restricted rents, and the value of that obligation depends on who the units serve. At 25 Water Street, 330 of 1,320 apartments are income-restricted: 238 studios, 73 one-bedrooms and 19 homes with two or three bedrooms. Studios are 72 percent of the restricted units there; at 55 Broad Street and 5 Times Square they are 49 and 84 percent of all units.6 The statute allows that mix. A city that wants family housing should say so, because an exemption that buys mostly studios serves a different population from one that buys two-bedroom homes. HPD lets the owner choose between a restricted mix that mirrors the market-rate units and one that is at least half homes with two or more bedrooms and no more than a quarter studios. The Comptroller reports that the second option goes unused, so family units would need a change in HPD’s rule.7
A tax expenditure has a price only against a stated alternative. On the Comptroller’s alternatives, the bill is large and the question of who carries it has an answer.
Office buildings are a large part of New York’s tax base. The State Comptroller expected office properties to contribute 20.6 percent of the city’s property tax levy in fiscal 2025. Commercial property is 21.9 percent of all market value and 44.1 percent of billable assessed value, because the city’s class system taxes it more heavily than homes.8
Office market value fell from $202.3 billion in fiscal 2021 to $168.8 billion in fiscal 2022, a sixth in one year, and recovered to $204.8 billion by fiscal 2025. Billable value moved less because assessment phase-ins smooth the swings, yet the State Comptroller estimates the levy would have been $6.2 billion higher over fiscal 2022 to 2025 had billable value kept its earlier 6.3 percent annual growth. Office vacancy in the city stood at 11.1 percent at the end of 2019; Manhattan’s reached 23.6 percent in the second quarter of 2024, the highest in a series that begins in 1986. The 35 Manhattan buildings with some conversion activity gained 9.9 percent in market value from fiscal 2020 to 2025, against 2.6 percent for all Manhattan offices. Conversion can restore value to the rolls; the exemption decides how much of it the city collects.
At 25 Water Street the Comptroller models two completed conversions over 37 years, with two construction years, 3.5 percent annual tax growth and a 4.5 percent discount rate. The building pays $67 million in present-value taxes under 467-m and $605 million fully taxed at market rate. A separate calculation puts the exemption’s tax expenditure at $434 million.9 Neither case is continued office use, so neither is the City’s loss had it withheld the exemption from a building that would have stayed an office.
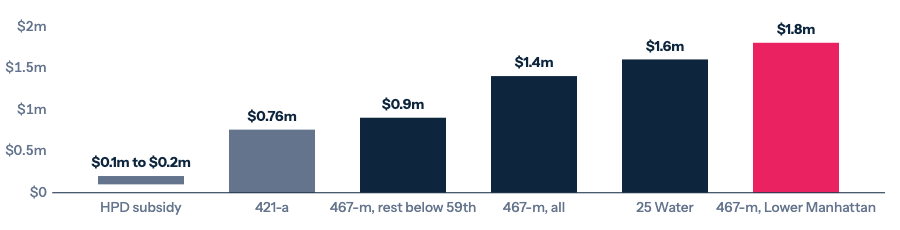
The choice of alternative carries the analysis. The Comptroller reports that 25 Water Street began construction in 2023 and qualified for the exemption retroactively, and reads its feasibility as settled before the program passed.10 On that reading a fully taxed conversion is the right comparison, and the $538 million gap is the price of the building’s 330 restricted apartments: $1.6 million each, or $2.3 million per restricted bedroom counting a studio as half a bedroom. The timing bears on who kept the gain. The deed for the building’s sale, at about $251 million, was recorded on December 28, 2022, about two weeks before the Governor’s State of the State proposed tax relief for conversions, so the price is unlikely to have included the enacted terms. The exemption passed in 2024 was also richer than the one first proposed. The transaction timing makes seller capture less likely than in a post-enactment sale, but the realized incidence cannot be observed from public records.11

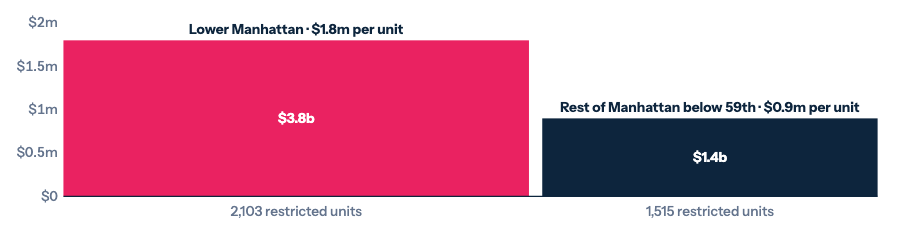
The Comptroller applies the same accounting to the pipeline that could qualify by starting before June 30, 2026: about 12.2 million gross square feet in Manhattan below 59th Street, with roughly 14,500 apartments, 3,617 of them income-restricted. Later starts are outside the estimate. Over 37 years at a 4.5 percent discount rate, the exemptions carry a present-value tax expenditure of $5.6 billion and an opportunity cost of $5.1 billion.12 The baselines differ by submarket. In Lower Manhattan the Comptroller treats a fully taxed conversion as the alternative; in the rest of Manhattan below 59th Street, continued office use.
On those baselines the opportunity cost is $3.8 billion for 2,103 restricted units in Lower Manhattan, $1.8 million each, and $1.4 billion for 1,515 units in the rest of Manhattan below 59th Street, $0.9 million each; the submarket figures are rounded as published. The Comptroller concludes that the exemption is “more likely to be pivotal” in Midtown and “likely too generous” in Lower Manhattan. Part of the gap comes from the baselines, since a taxed-conversion baseline raises the Lower Manhattan figure. A separate caveat runs the other way: where the exemption is pivotal it brings forward every unit in the building, so charging its whole cost to the restricted quarter overstates the price of affordability there.
The Department of Finance’s fiscal 2026 tax-expenditure report includes 467-m but records its cost as “None. This is a new program.”13 The entry does not mean the program has no fiscal cost. It means Finance had not yet estimated one. Owners apply after completion, and HPD applies the benefit retroactively, so construction-period exemptions can appear when projects are certified and placed on the roll. The City’s annual financial report also omits 467-m, as show below.
The opportunity cost sets what the city gives up against one benefit, the restricted rents. Three others belong in the same account, and no public source prices them. The first is housing supply in a city whose rental vacancy rate was 1.4 percent in the 2023 Housing and Vacancy Survey: the pipeline’s roughly 14,500 apartments, most at market rents, add homes where they are scarcest.14 The second is the tax base. Where the exemption decides whether a building converts, as the Comptroller expects in the rest of Manhattan below 59th Street, the alternative is a half-empty office losing value, and the converted building will in time pay more than that office would have. The third is the rest of the office market: removing weak supply can support rents and values in the buildings that stay offices, which carry a large share of the levy.
These benefits leave the question of who pays unchanged. They bear on whether the price is worth paying, and on the Comptroller’s reading they are most likely to be additional where its cost per unit is lowest. In Lower Manhattan, where conversions were proceeding without the exemption, the same benefits would have arrived at a far lower public price. A city that wants to claim them should estimate them and publish the estimate beside the cost.
The concession is paid first out of City revenue, and New York’s rules decide how much of it other owners make up. The City sets a property tax levy, divides it among four tax classes and derives each class’s rate; the citywide average rate has been held at 12.283 percent since fiscal 2009, so the levy moves with the taxable roll. Residential rental buildings sit in Class 2, which carries $14.9 billion of the $38.0 billion levy in fiscal 2026.15 State law requires the City Council to lower a class’s share of the levy when new exemptions or changes of class take value off that class’s taxable roll, and the Council’s certified fiscal 2026 calculation applies the adjustment to taxable assessed value.16 A converted office therefore leaves the office class’s taxable roll and, while it is exempt, adds little to the apartment class’s. On that reading, the forgone tax mostly shows up as lower City revenue, and whatever part is recovered from other owners is spread across all four classes roughly in proportion to their shares of the levy. The Independent Budget Office reached a different answer for 421-a, that the burden falls within the exempt building’s class, but only by holding class shares fixed in its simulation.17 On the Comptroller’s 3.5 percent growth path, the $5.1 billion opportunity cost starts at about $170 million a year, under half of one percent of the fiscal 2026 levy.
The value the exemption adds goes first to whoever controls the building when the benefit becomes certain. Because 467-m is as-of-right and its schedule is published, a buyer can bid it into the purchase price, and the $128 to $151 a gross square foot it adds to residual value becomes a gain for the seller of an unconverted building. Applied across the 12.2 million qualifying square feet, the two methods imply added land value of about $1.6 billion to $1.8 billion, an upper bound because not every building fits the stylized case. The Comptroller’s case study of 750 Third Avenue applies the same model and suggests the property could be worth $98 million to $115 million less without the exemption.18 Where a building is in distress, the same added value raises what its lender recovers. At 1740 Broadway, a $308 million loan was resolved by a sale recorded on April 24, 2024, four days after the exemption was enacted, at a price reported at $180 million to $186 million; after $62.3 million of liquidation costs, bondholders recovered about $117 million, and the top-rated bonds lost roughly a quarter.19 The loss was struck as the exemption was being enacted. Where conversion is feasible, lenders to buildings still unsold can now recover more.
Restricted tenants receive the rent discounts. The Comptroller values the restrictions at about $4.2 billion in present value, 81 percent of the opportunity cost, and warns that this estimate is likely biased upward.20 At least $0.9 billion of the $5.1 billion, therefore, does not come back as lower rents. Where the exemption decides whether a building converts, that remainder pays for real conversion costs and buys market-rate homes. Where it does not, chiefly in Lower Manhattan, it accrues on the model to the owners, sellers and lenders of the buildings.
The cost per restricted unit charges a building’s whole opportunity cost to its restricted quarter, so it overstates the price of affordability where the exemption is pivotal. It is relatively high nevertheless. The Independent Budget Office puts the City’s own capital subsidy for new affordable units at around $100,000 to $200,000 each, before federal tax credits and state funds. The Comptroller put 421-a’s tax expenditure at $757,000 per income-restricted unit at a 6 percent discount rate; the same measure for 467-m is about $1.55 million at 4.5 percent.21 Chicago’s LaSalle conversions, the closest direct comparison, carry about $588,000 of up-front increment financing per affordable unit. The last New York conversion program offers a warning. The Citizens Budget Commission found that 421-g cost at least $1.17 billion in nominal dollars for 12,865 units in Lower Manhattan, about $92,000 each, with no affordability requirement, and that “some of these conversions would likely have occurred without 421-g”; at least ten later conversions with 3,171 units received no tax break at all.22
A pipeline total counts intentions and a cap bounds a budget. Neither tells a city what it received.
Pipeline totals are the most quoted conversion statistics and the easiest to misuse. The Comptroller’s early-2025 inventory lists 44 New York conversions, completed, underway or projected, with 15.2 million gross square feet and 17,432 potential units. Tabulated by the status flags in its appendix, four rental buildings with 1,457 units were flagged complete.23
Ten buildings with 5,849 units were underway, 19 with 9,202 units were projected, one of them without data, and 12 condominium conversions held 921 units. Because an office building’s rentable area often exceeds its gross area, the Comptroller estimates the conversions could remove 15 to 16 million rentable square feet of Manhattan office supply, more than a third of the 43 million square feet of occupancy that buildings outside the top tier lost from the end of 2019 to early 2025.

Delivery has legal stages: permit, construction, then temporary and final certificates of occupancy. A final certificate is the strongest public confirmation that a whole-building conversion is complete on its approved terms, although a temporary certificate can permit occupancy. City records through September 14, 2026 show no final certificate matched to the whole-building conversion job of any of the 45 listings in The Power Curve’s dataset. Eleven buildings with 4,423 units have received temporary certificates, including all four the Comptroller counted as complete. Another 20 with 9,143 units hold conversion permits without a certificate, five with 1,197 units have filed without a permit, and The Power Curve found no whole-building conversion permit for nine with 2,666 units.24
25 Water Street received its first temporary certificate, for 1,320 units, in February 2025. The Department of Finance’s fiscal 2027 roll exempts 90 percent of its assessed value under 467-m, the first roll to do so. HPD’s production data list 14 projects with a planned 467-m benefit, 2,457 units and 618 affordable, for starts through March 2026; the six with completion dates are the six parcels the roll exempts.25
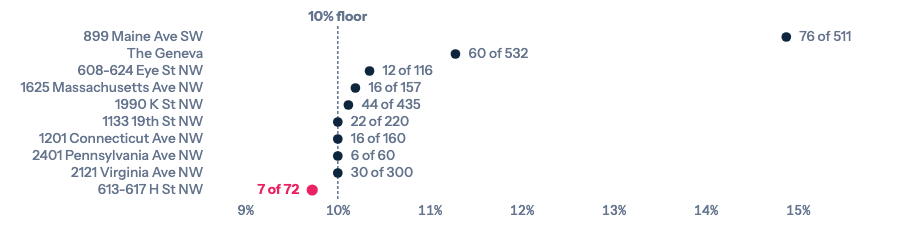
Washington shows how counts move between announcement and delivery. The District’s first award announcement, in September 2024, promised at least 69 affordable units in a 525-unit project at 1825 and 1875 Connecticut Avenue, now called The Geneva, and at least 8 at 615 H Street.26 At The Geneva’s groundbreaking in January 2026, the District listed 60 affordable units of 532, and the H Street project 7 of 72. The lender’s release describes The Geneva as 429 market-rate, 42 extended-stay and 61 affordable units.27 Three official counts for one building, 69, 61 and 60, are the drift a delivery file exists to catch.
The District’s Housing in Downtown program pays a 20-year property-tax abatement, from the certificate of occupancy, for a change of use that produces at least ten homes, with at least 10 percent of units at 60 percent of median family income or 18 percent at 80 percent. The statute sets each award at “an annual amount, as reasonably determined by the Mayor for each property,” with no formula. The Mayor selects projects through a competitive process, and the reservation letter must state each abatement’s expected amount and the certification its annual dollar amount; the District publishes neither.28 It caps the program at $2.5 million a year for fiscal 2024 to 2026, $5 million for 2027 and $41 million for 2028, and each later year’s cap is 104 percent of the year before.29 District announcements describe Housing in Downtown as a “$41 million investment.” The statute instead sets a maximum annual amount of abatements: $41 million in fiscal 2028, growing by 4 percent each year thereafter. If every annual ceiling were fully used and the statutory growth path remained unchanged, the ceilings would reach about $86 million in fiscal 2047 and sum to about $1.2 billion in nominal dollars over fiscal 2028 through 2047, on The Power Curve’s arithmetic. This is a maximum-cap path, not an estimate of the value of the ten awards or of realized revenue forgone. The District has published neither. The District’s Chief Financial Officer has scored changes to the cap, pricing a cut in the fiscal 2027 ceiling from $6.8 million to $5 million at $1.8 million of revenue, and has published no value for any award.30
The ten awards announced by January 2026 carry 2,563 units, 289 of them affordable, across 2,835,492 square feet in the District’s table, which lists The Geneva at 1.1 million square feet against 604,000 in the same release. Eight sit at or just above the 10 percent floor, the Maine Avenue project is at 14.9 percent, and the H Street project, at 9.7 percent, is below it on the District’s own table. Washington’s floor is shallower in share than New York’s 25 percent and deeper in income, at 60 percent of median family income against a weighted 80 percent. The District reports 1,904 units converted from office use in 2024 and 2025, about 1,803 under construction and 4,258 more in the pipeline, toward a goal of 15,000 new downtown residents by 2028.
The Geneva’s financing also uses a statutory financing tool with a public dimension. The project closed a $465 million Commercial Property Assessed Clean Energy, or C-PACE, loan and a $110 million senior loan in January 2026. C-PACE financing is repaid through an assessment on the property tax bill.31 District law gives an unpaid assessment priority behind delinquent property taxes and ahead of a mortgage.32 That priority can reduce lender risk and expand the project’s financing capacity. It is not a District guarantee or direct public loan. The District has not published the abatement’s annual value, complete sources and uses, or the basis on which the award amount was set.
Other cities show how unevenly the price of support is published. Chicago’s City Council approved up to $221 million in tax-increment financing for four LaSalle Street conversions with 1,248 units, 376 of them affordable: about $177,000 per unit and $588,000 per affordable unit, about a third of the four projects’ $651 million total cost, before the housing and historic tax credits some projects also receive.33 Calgary pays grants of up to C$75 a square foot, capped at C$15 million a building, and committed C$80.6 million, C$52.5 million of it from the federal Housing Accelerator Fund, to a June 2025 cohort of about 1,100 homes; across its intakes to that date it reported 21 projects, 2.68 million square feet, and more than 2,600 homes.34 San Francisco’s Controller put the cost of waiving the transfer tax on the first 5 million converted square feet at $34 million to $150 million over 30 years.35 Boston offers a 75 percent abatement for 29 years and reports 22 applications covering 1,517 homes, 284 of them income-restricted, with no published estimate of revenue forgone. Four of those projects, with 236 homes, were under construction, and one, 281 Franklin Street, was fully leased.36
What each city discloses
The instruments differ in kind, timing, and currency, so the table records disclosure and does not rank the programs. New York counts are income-restricted units; the other cities’ counts are affordable units on their own definitions.
| Instrument | Public cost disclosed | Units disclosed | |
|---|---|---|---|
| New York 467-m | Tax exemption, up to 35 years after completion | $5.6b tax expenditure, present value (Comptroller); City ledger lists 467-m as new, without an estimate | 14,500 pipeline units, 3,617 restricted |
| Washington Housing in Downtown | Discretionary 20-year abatement | Annual caps only; no award values | 2,563 awarded, 289 affordable |
| Chicago LaSalle | Up-front tax-increment financing | $221m for four projects, before tax credits | 1,248 approved, 376 affordable |
| Calgary | Grant up to C$75 per sq ft | C$80.6m for the June 2025 cohort, C$52.5m federal | About 1,100 homes |
| San Francisco | Transfer-tax waiver on first sale | $34m to $150m over 30 years, nominal (Controller) | Not reported |
| Boston | 75 percent abatement for 29 years | No estimate published | 1,517 applied for, 284 restricted |
A test works only where an official can apply it, so the rule has to follow the program’s design: as-of-right in New York, discretionary in Washington.
Debates over incentives often shrink the counterfactual to whether the project would have happened anyway. A project can proceed without support and deliver fewer restricted units. It can proceed later, after a different purchase, or as condominiums. It can stay an office for years, be renovated, or be sold. Each alternative changes both the fiscal case and who benefits.
A review should state four things: the building’s fate without support, the timing, the unit mix and affordability, and the city’s contribution in each case. Where an answer is uncertain, the reviewer can grade the evidence: documented no-incentive underwriting, a documented alternative project or timing, a documented affordability trade-off, plausible and unverified, or unknown. The grade is a record of judgment, and it lets a later evaluation test it. A program that keeps funding projects graded “unknown” has a governance problem, whatever its long-run effect on supply.
Self-reported underwriting is weak evidence, because an applicant who needs an incentive has every reason to show a gap. The strongest designs therefore use information the applicant cannot shade: a benefit set by formula, a competitive allocation under a fixed budget, and terms that return value to the city if the building sells for more than the underwriting claimed.
467-m is as-of-right. A building that meets the statute receives the exemption once HPD certifies it, and no city official can defer an award, decline it, or trade its size for a better outcome. The design has merits: it removes discretion, speeds decisions, and gives lenders a benefit they can underwrite. A different price needs a change to the statute.
The Comptroller’s findings show where a change would matter. One 90 percent rate below 96th Street pays the same in Lower Manhattan, where conversions were proceeding at market rents, as in the rest of Manhattan below 59th Street, where the exemption is more likely to decide whether a building converts. A rate that varied by submarket, a program cap, or a shorter full-rate period for later starts would each lower the cost per restricted unit where the exemption buys least, and the June 2031 start deadline sets a date to decide. HPD’s regulatory agreement can add what the statute leaves open, such as a published unit schedule for each building and a claim on part of the gain if a certified building sells soon after completion. The Department of Finance can report an estimate each year, and the Comptroller can audit the first cohort against its own model.
Reporting already has a home. The City’s annual financial report discloses tax abatements under the governmental accounting standard for them, GASB Statement 77, and shows 421-a and 421-g reducing revenue by $1.96 billion in fiscal 2025. It does not mention 467-m.37 Adding it there would put the cost beside the programs it resembles.
Where an official does choose, as in Washington or Chicago, a protocol can be applied award by award. Washington’s Mayor already sets each abatement’s amount under a cap; the protocol asks the District to publish that amount, its baseline, and the affordable count it secures, and to report each award at occupancy.
City decision protocol
| Step | Required record | |
|---|---|---|
| 01 | Establish the baseline | Dated underwriting, purchase price, bids, financing, alternative use, and independent review. |
| 02 | Name the outcome | Whether the award buys feasibility, timing, affordability, duration, or a public-realm obligation. |
| 03 | Contract for delivery | Unit mix, affordability, duration, milestones, reporting, remedies, and clawbacks. |
| 04 | Price and decide | The award’s annual and present value against the baseline. Approve if the outcome, terms and cost are defined; approve with conditions if gaps remain; defer if no baseline exists; decline or refer an opaque transfer or a physical barrier. |
| 05 | Audit after award | Delivery, occupancy, affordability, and fiscal cost against the approved record. |
Disclosure can scale with the award. A rule-based program needs a public file with the rules, the estimated cost, units by income band, the completion window and each project’s status, reported as an annual cohort from application to final occupancy. A negotiated or unusually large award needs the full case file, held in confidence where it must be, with a public summary of the benefit, the condition and the delivery date. Washington’s statute already requires a recorded affordability covenant for each award, so its case file has a natural home.
A tax incentive is one instrument among several. It should be used where the constraint is the purchase price, and priced where it is used.
A project-specific tax incentive can buy durable affordability in an otherwise viable building. It cannot repair an unconvertible floor-plate, stand in for transit investment, or rescue an implausible capital structure. A city needs a different tool for each constraint.
Match the tool to the constraint
| Tool | Minimum record | Withhold fiscal support if | |
|---|---|---|---|
| Physical form | Zoning, code reform, technical assistance | A technical diagnosis and a feasible path | The building cannot meet residential standards at a viable cost |
| Conversion feasibility and residual value | Rule-based tax incentive with affordability terms, a cap, and resale recapture | Building-level account of acquisition basis, conversion cost, projected income, financing, unit terms, delivery window, and program cost | The project is viable, or a published benefit will be capitalized into an acquisition price without securing an additional public outcome |
| Financing | Debt tools and capital coordination | Independent review of the capital stack | The gap reflects an opaque or unsustainable capital structure |
| Discretionary scale | Negotiated award | The full protocol, with remedies in the agreement | Terms, milestones or remedies cannot be monitored |
New York’s evidence should not be exported whole. Its tax classes, 467-m schedule, Manhattan rents, building stock and public data are unusual. Other business districts may face lower rents, different building geometry, weaker transit or thinner capacity to monitor projects. The test travels when the local constraint, the plausible alternative use, the outcome, the fiscal capacity and the power to enforce are all stated.
The table sets out the answer for New York on the published evidence. Washington’s abatement works differently: it reduces the District’s revenue directly, up to a cap of $41 million a year from fiscal 2028, so the District’s general fund bears it, and the missing piece is the amount of each award. The cap itself can move: the District has already cut its fiscal 2027 ceiling from $6.8 million to $5 million.
Who pays, by party
| Pays or gains | Size, on the published evidence | |
|---|---|---|
| City revenue and other owners | Bear the tax forgone: mostly as lower City revenue, with any part other owners pay spread across all four classes | About $170m in the first year and rising; under half of one percent of the levy |
| Restricted tenants | Gain rent discounts on 3,617 units | About $4.2b in present value, likely overstated (Comptroller) |
| Owners, sellers, and lenders | May capture residual value where the exemption is not pivotal | Model implies up to $1.6b to $1.8b of added land value across qualifying square footage |
| Other renters and office owners | Gain added housing supply and less competing office space | Not priced by any public source |
In New York, the fiscal concession reduces City revenue under the report’s reading of the property-tax rules, while restricted tenants receive modeled rent discounts. Where the exemption is not pivotal, its residual value may accrue to owners, sellers, or lenders, but public records cannot allocate that incidence project by project. Each concession should buy a named result at a stated price, with terms that prove delivery. New York has an independent estimate, while the City has not yet published its own cost estimate; Washington sets an amount for each award and publishes none.
| Variable | What it signals | Reading | Trigger |
|---|---|---|---|
| 467-m in the City ledger | Finance's estimate and realized cost against the Comptroller's projection | Listed as new program without estimate, FY2026 | First published estimate or realized-cost entry, and its method |
| Certified 467-m buildings | Whether the pipeline delivers | No final certificates matched to whole-building conversion jobs in The Power Curve’s dataset; six parcels on the fiscal 2027 roll, Sept. 2026 | Final certificates and HPD’s first report of certified units |
| Sale prices of exempt buildings | How much of the exemption sellers capture | Unobserved | Sales of certified buildings against comparable taxed conversions |
| Washington award values | The price of each abatement | Undisclosed | Any published annual value per award |
| Affordable counts at delivery | Drift between award and occupancy | Geneva 69 to 60; H Street 8 to 7 | Counts at certificate of occupancy against award |
| Washington’s fiscal 2028 cap | Whether the ceiling holds | $41m in statute | Any budget act that changes the cap |
| Albany action on 467-m | Whether the rate or window changes | No change reported | Any bill amending rates, windows or a cap |
| What it establishes | What remains unknown | Decision implication | |
|---|---|---|---|
| 25 Water Street | A $538m modeled gap between a taxed and an exempt conversion, most of it a gain to the 2022 buyer. | The realized value of that gain and of the restricted units’ rent discounts. | Report certified cost and delivery against the model. |
| NYC 467-m pipeline | A $5.1b modeled opportunity cost for starts by June 2026, $1.8m per restricted unit in Lower Manhattan. | Realized cost, take-up, and which starts the exemption made pivotal. | Price the benefit by submarket and report it in the annual ledger. |
| NYC price sample | Prices fell 7 to 71 percent in a selected sample. | Citywide depreciation and lender losses. | Use it as a feasibility signal only. |
| The Geneva | Disclosed debt and a 20-year abatement whose amount the Mayor set. | The abatement’s published value, total cost, and why affordable units fell from 69 to 60. | Price support only from a complete, reconciled case file. |
| 421-g, 1995 to 2006 | 12,865 units for at least $1.17b, with no affordability requirement. | How many conversions would have happened without it. | Build a lookback into 467-m before its 2031 start deadline. |
| Washington cohort | Ten awards, 2,563 units, 289 affordable, under annual caps. | The published amount of each award. | Publish each award’s annual value before the covenant is signed. |